Where to Construct Amazon HQ2

Recent Blogs
- Market Outlook Fed Watch Part 2
- Market Outlook Fed Watch
- The Bipartisan Infrastructure Plan and Construction Costs
- Steel Industry Volatility, Risks & Risk Mitigation
- Total Benefit - HVAC
- The Ins and Outs of Insulated Concrete Forms
- Mini Construction Market Update
- Where Did All the Wood Go
- How Do You Price an Elephant
- What if This is the Recession?
- The Pitfalls of Dollar per Square Foot Estimating
HQ2 fever has economists in North America speculating more than high rollers at a Vegas casino. At the onset, major metropolitans on the East coast and even an Alaskan community, threw their hat in the ring to be considered for Amazon’s second headquarters.
The field has been narrowed down to 20 and the internet is ablaze with opinions on where a second campus will be built to support their operations in Seattle. Among the criteria in the selection process are the more obvious: proximity to an international airport and major highway, talent pool and current and future real estate opportunity.
This article is on something that we as construction economists feel is equally important: the construction forecast of each market. As North America’s Construction Economist, pricing large-scale construction projects nationally, we are poised to offer our expertise to the matter. As we offer in our Beyond Estimation Market Outlook® presentation, we know that, like other sectors of the economy, the size and growth of the construction market is not uniform.
Let’s begin with some of the inputs of the analysis. According to Amazon, the intent is to one day blossom into an 8 million square foot campus to rival their original. The capital investments are being estimated at $5 billion over the next 15 years or so; amortizing over that time period equates to approximately $333 million per year. Assuming a 35% premium on construction costs to attain overall projects costs, this means about $250 million in annual construction costs. It is imperative to realize that HQ2 campus will not likely be built in an evenly distributed fashion as perfectly as our analysis shows. Depending on how busy the market is, Amazon could structure their construction spend to capitalize on possible downturns, regional market fluctuations, raw material availability, etc. However, we will conceptually assume the trend line will hold true throughout the construction of HQ2. Also, being assumed is that the $5B is a necessary figure for construction in each market when the reality is it will go a lot further in some markets relative to others. Important to note that cost indexing, construction unemployment rates, etc. are key variables, but we are primarily focused on market saturation for this study.
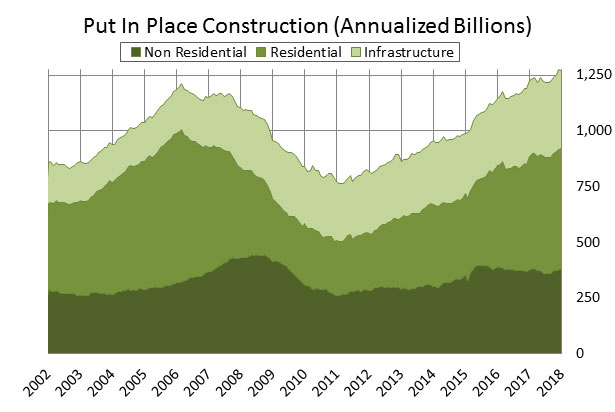
Since we don’t suspect that the Amazon team has figured out how to build via drones a la their audacious package delivery goals, they will need construction workers to build. Currently, we have a $1.25 trillion construction economy built on the backs of 7.2 million construction workers; this means that each construction worker can put in place roughly $175 thousand each year. Using this $175 thousand per construction worker factor, this means that each year that wherever HQ2 is constructed, 1,428 construction workers will be required for HQ2 alone.
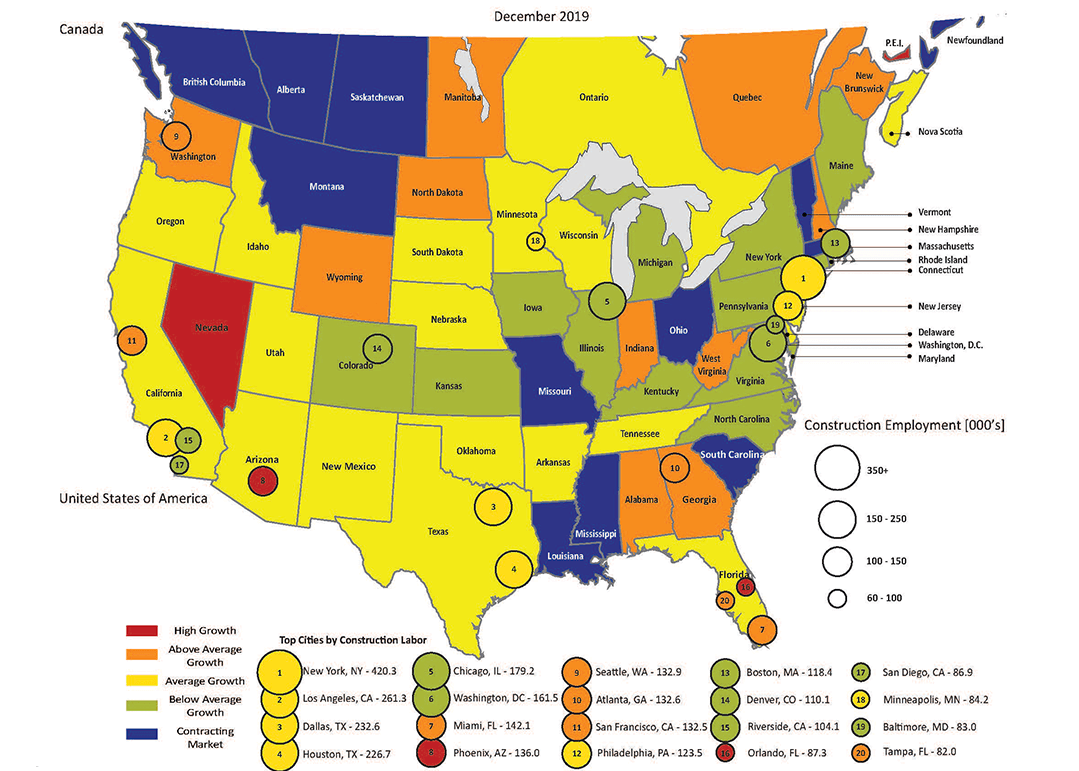
In order to review the impact of the labor force, we have to analyze the construction markets by the three sectors they are evaluated in nationally and regionally: infrastructure, residential and non-residential; the last of which is where Amazon HQ2 will reside.
For the analysis of each location still in play, we will assume that the non-residential sector is a third of the overall construction market.
So then, what would make for an ideal market to build from a construction perspective? To start an ideal pick would be a market that could handle an increase of over 1,400 construction workers to the workforce. From what we have experienced coming out of the recession, the tipping point seems to be exceeding a 5% growth in construction workers per year. From there, we’d further recommend taking advantage of a metro whose market expansion coming out of the recession has not yet exceeded 28%, the national average. Should the increase to the workforce exceed 5% or the growth rate exceed 28% since the recession, we consider that market to be at risk for saturation and to have increased escalation rates. Therefore, it’s in Amazon’s best interests to build where the workforce currently has the capacity and has the potential to support further expansion.
Without further ado, here are the results based on the 20 cities currently shortlisted:
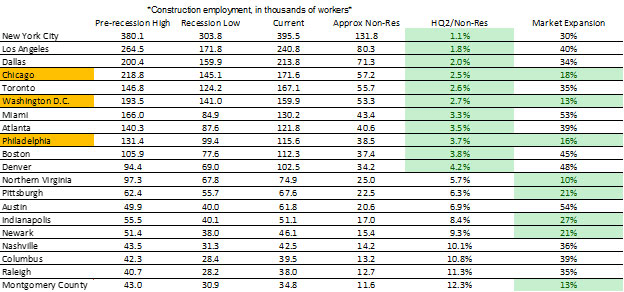
Atlanta, Boston, Toronto, etc. are large enough to incur the additional workforce without too much risk of burdening the rest of the construction market were it not for their growth since 2012 when construction began to rise from its bottom. Pittsburgh, Indianapolis, Newark, etc. have all grown, but remain below the national average and have escalation rates 4% or less; however, the increase to the workforce may dampen a respectively small construction workforce. Therefore, Chicago, Washington, DC and Philadelphia are, to borrow a phrase from Goldilocks and the Three Bears, ‘just right.’
Of the three, there is no clear-cut favorite from our perspective; they all represent similarly sized workforces and have remained well below the national average for year-over-year labor growth. Should this factor into the criteria as heavily as some of the other economic and proximity data is not for us to decide. It is our recommendation that wherever Amazon is to choose, they do their homework to maximize their capital investment dollars; as the data shows, the when and the where matter nearly as much as the what in construction projects.

Zachary Bergeron
Principal
Zachary has been in the industry for over 2 decades. He is interested in the company’s more complex and challenging projects.

Vikrant Parikh
Associate
Vikrant has been in the industry for over 2 decades. He is an architect and interior designer with
international experience ranging from design to construction to project
management.
Previous Blogs