The Bipartisan Infrastructure Plan and Construction Costs
The Bipartisan Infrastructure Plan and Construction Costs
Recent Blogs
- The Feds New Normal
- Market Outlook Fed Watch
- Steel Industry Volatility, Risks & Risk Mitigation
- Market Outlook Fed Watch Part 2
- Total Benefit - HVAC
- The Ins and Outs of Insulated Concrete Forms
- Mini Construction Market Update
- How Do You Price an Elephant
- Where Did All the Wood Go
- What if This is the Recession?
The unprecedented monetary and fiscal stimulus injected into the economy at the onset of the pandemic has had a rapid effect on financial markets, successfully preventing a sudden recession and hardship in the economy. After many months of stimulus, it seems that rapid removal of that stimulus will be required to halt the opposite effect of price spirals and excess demand. This has brought the anticipated timelines of an end to stimulus forward by many months. Responsiveness to economic realities is part of the “new normal”, so, as events unfold over the course of this year, we should be ready for significant moves by both monetary and fiscal policymakers.
Construction, particularly residential and infrastructure, is a sector of the economy that could experience a positive long-term structural shift, much as other sectors could see long-term declines, due to the realities of a post-pandemic world
Below are bullet point interpretations of fiscal measures, including the Bipartisan Infrastructure Plan, Rescue and Relief Plans, and their effect on construction volumes. For more information on these topics and construction price levels, sign up for our Market Outlook Forum and Quarterly.
The original infrastructure bill proposed $2.6 trillion in infrastructure spending by the federal government with the majority of spending going towards in-home care, buildings, and innovation.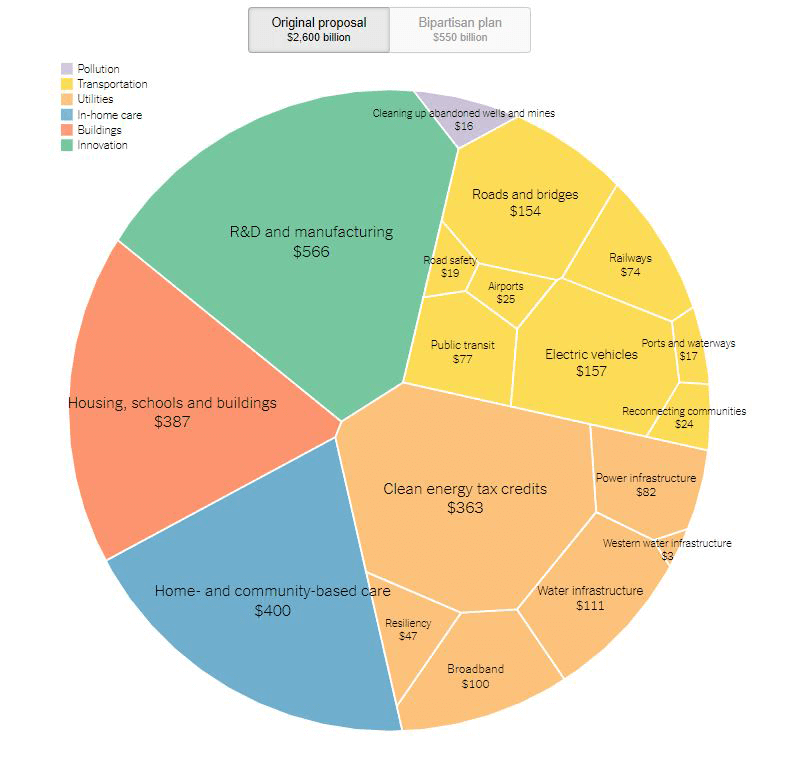
However, since the original proposal, the bill has been redefined as $550 billion to be spent over 5 to 10 years. The Bipartisan Plan is less than one-quarter of the originally proposed Infrastructure spending plan with the entire focus shifted onto transportation, utilities, and pollution cleanup.
.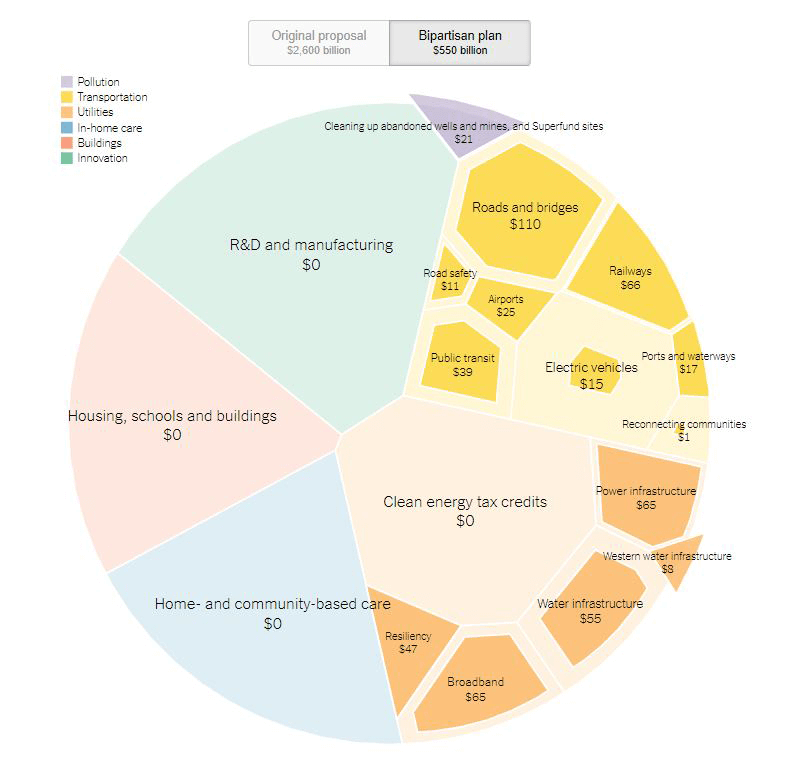
source: https://www.nytimes.com/interactive/2021/07/28/upshot/infrastructure-breakdown.html
The Senate passed the bill with the following amounts listed in order of greatest expenditure
.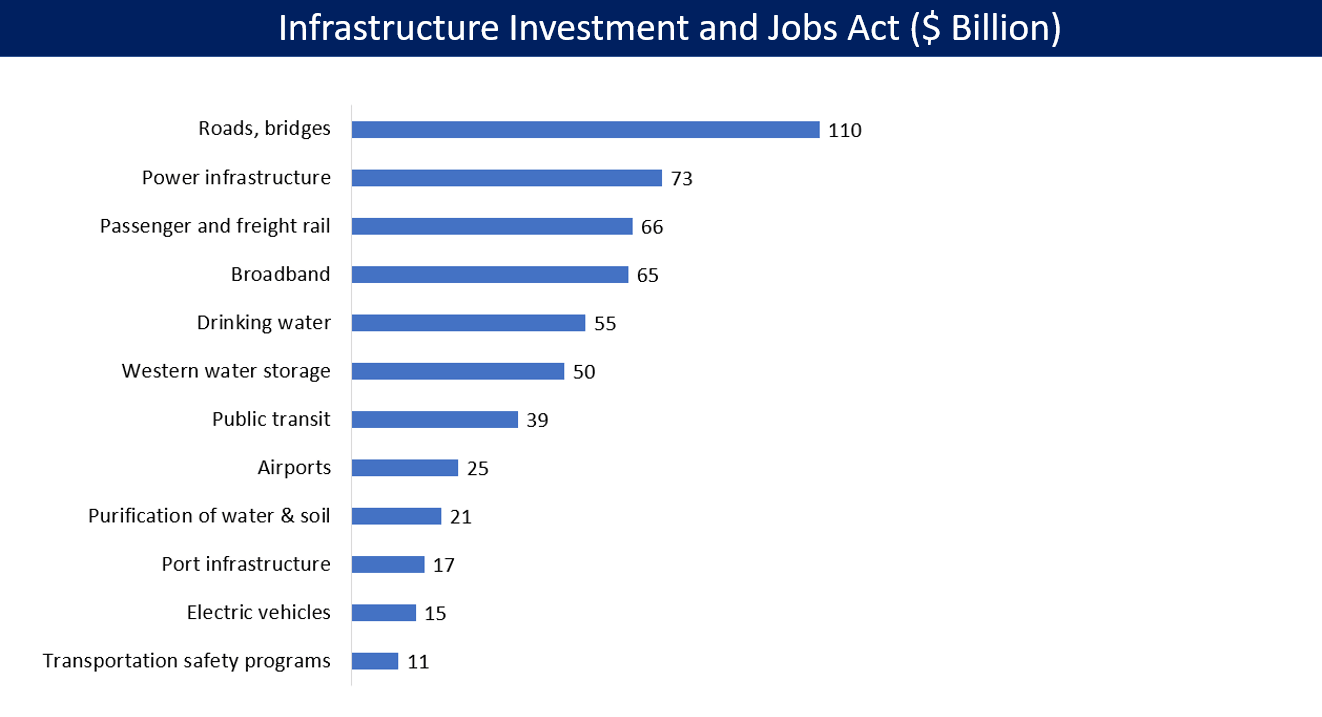
source: https://www.npr.org/2021/11/05/1050012853/the-house-has-passed-the-1-trillion-infrastructure-plan-sending-it-to-bidens-des
The federal government has spent $100 billion on infrastructure each year from 2016-2019 with an increase in spending to $150 billion in 2020 and 2021. The Bipartisan Infrastructure Bill would provide an additional $55 billion spent on infrastructure each year until 2031.
.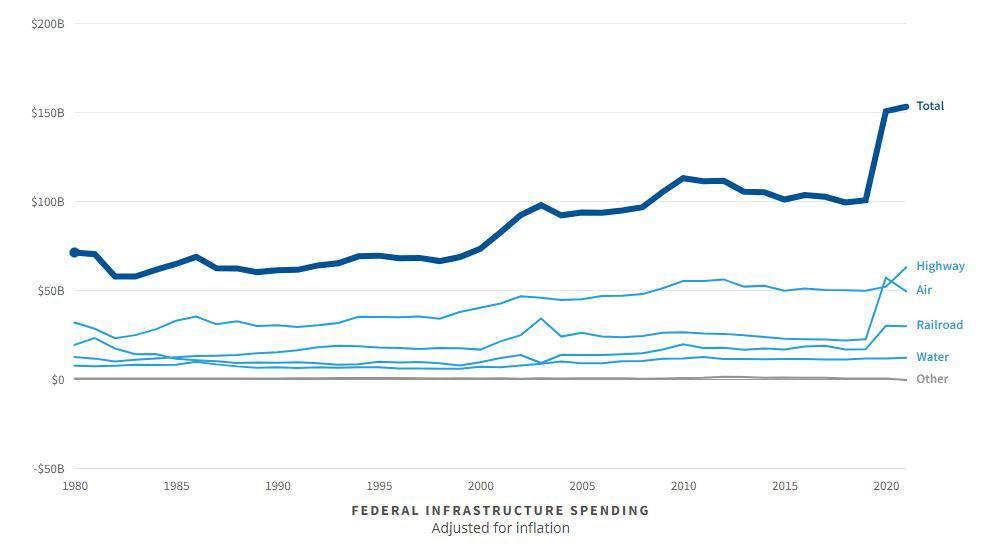
source: https://usafacts.org/state-of-the-union/transportation-infrastructure/
Infrastructure wasn’t the only increased expense in the past two years; spending drastically increased from the American Rescue Plan and Relief Packages. With spending from the rescue plans decreasing this year, the government will supply significantly less money into the economy, resulting in the fiscal impulse becoming negative. Despite the $55 billion the government will add to infrastructure spending each year, the overall spending will decrease from the previous 2 years. As shown in the graph, even with the addition of the Bipartisan Plan, the fiscal impulse will still be a drag for the next few years.
.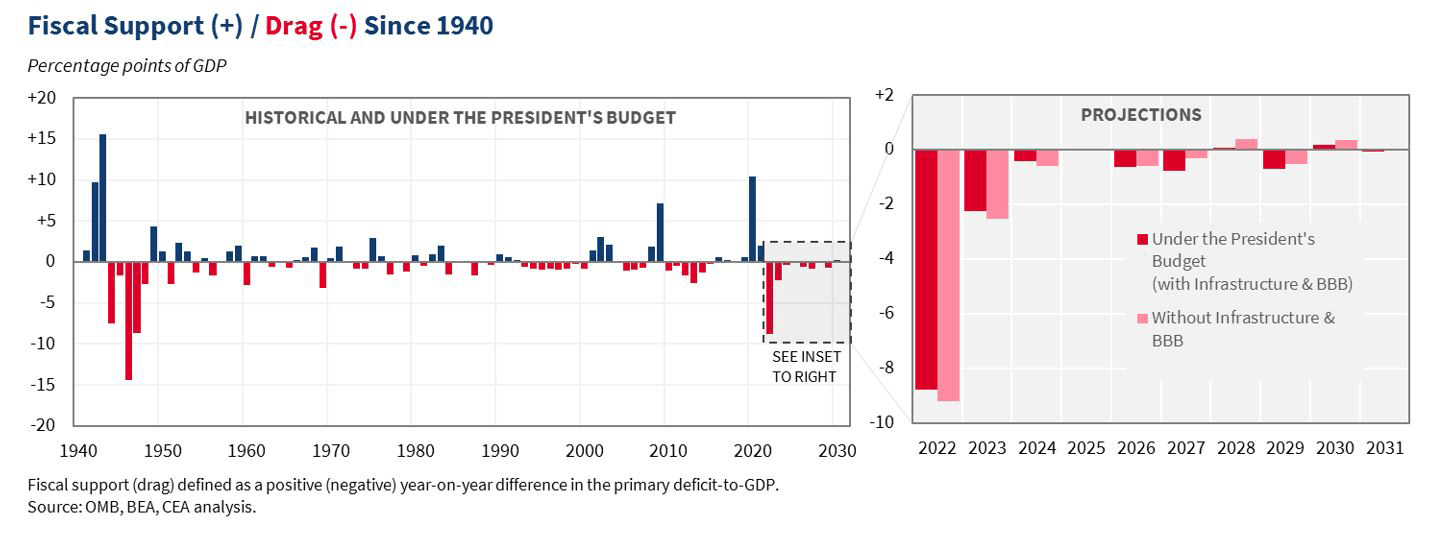
“Fiscal impulse can be positive, neutral, or negative depending on whether government spending or revenue is increasing, stable, or decreasing. If, for example, fiscal outlays went up by $1 trillion last year and $500 billion this year, this would constitute a “negative fiscal impulse” and a drag on growth, even though we spent $500 billion on top of last year’s trillion because of the decrease in spending.”
With the addition of the Bipartisan Plan, the infrastructure would make up 1.3% of the GDP rather than the originally project 0.8%.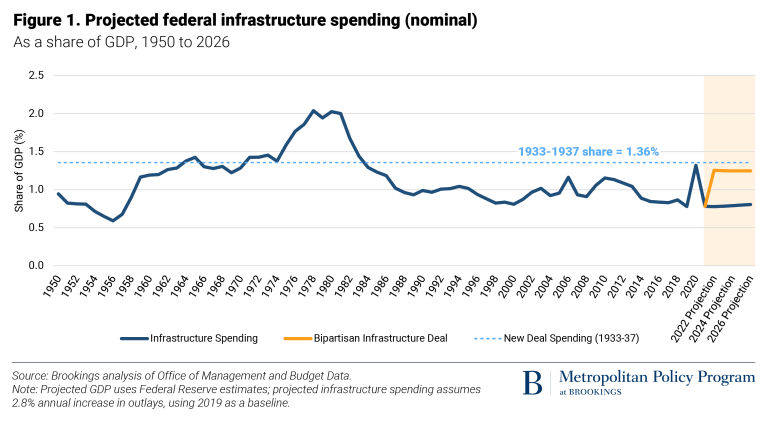
source: https://www.brookings.edu/blog/the-avenue/2021/08/05/the-senate-infrastructure-bill-puts-america-closer-to-another-new-deal/
Despite more money being added directly to infrastructure spending, federal government spending overall should decrease leading to a reduction in fiscal stimulus in the overall economy. A reduction in stimulus will counter expectationary inflation overall. Construction volume and subsequent demand pressure with increased infrastructure projects will continue to push on labor and material prices and contractor backlogs.

Richard Vermeulen
Senior Principal
Richard has been in the industry for over 3 decades. He is the creator of the Quarterly Market Outlook and chairs the Vermeulens Forum.

Stela Emiri
Project Manager
Stela is an Estimator and has been with Vermeulens since 2019. She has a Bachelor of Applied Science in Mechanical Engineering from the University of Toronto.

Jacob Kulpa
Project Manager
Jacob has been in the industry for over 5 years. He started with Vermeulens as a co-op student and joined full-time after his college graduation.
Previous Blogs