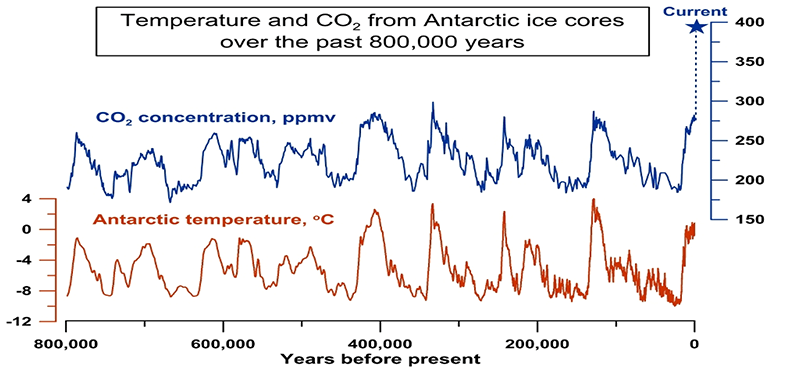
We're currently living in an Ice Age. For the last three million years, the planet has gone through many cycles of warming and cooling or glacial and interglacial periods. If we look at the graph, it's hard to say whether CO2 or temperature comes first, but the two are largely parallel. CO2 concentrations seem to have a Goldilocks level in about that 250 to 300 range. Of course, the alarm sounds off with the current levels of CO2.
It's also interesting to note that in the past four interglacial periods, peak temperatures are higher than we've seen in this current one of the past 12,000 to 15,000 years.
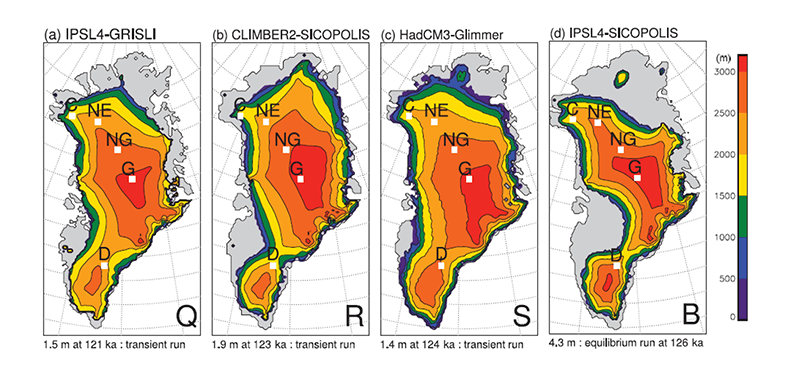
If you've ever glanced at a globe, you will see that Greenland is completely covered by ice that’s up to three kilometers thick. 125,000 years ago, as the planet warmed over the span of a few thousand years, sea levels rose above current levels by over 14 feet. Of course, this amongst others, is a risk that science points to with CO2 emissions. However, similar levels in global temperatures to the last warming might happen regardless of CO2 concentration.
As designers and economists, we measure and manage risks. It's part of our daily work. How do we go about engineering the planet to be not too hot, not too cold?
We'll be taking a closer look at these trends for 2021 as we go, but for now, I can share a few pieces of great news!
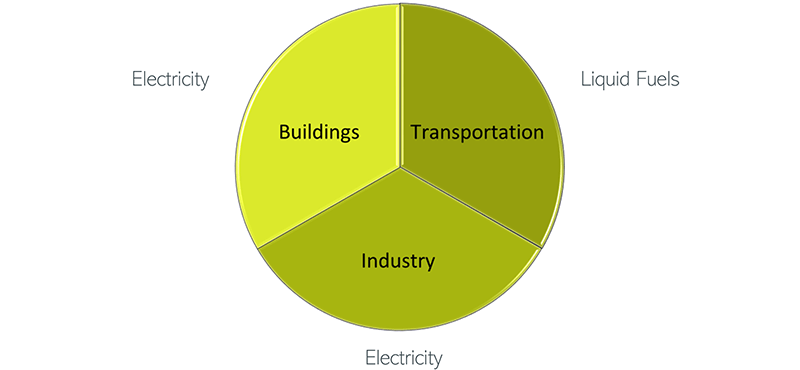
First, two thirds of our energy consumption can come from clean and renewable sources at competitive prices to fossil fuels. Here we show our energy pie dividing two thirds into buildings and industry.
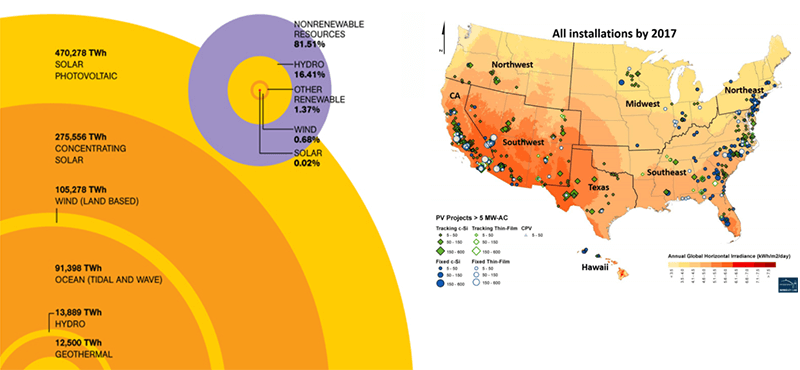
Second, these global supplies (yellow circle), dwarf our current consumption of energy (purple circle). North American supplies, especially solar, are particularly abundant where we live.
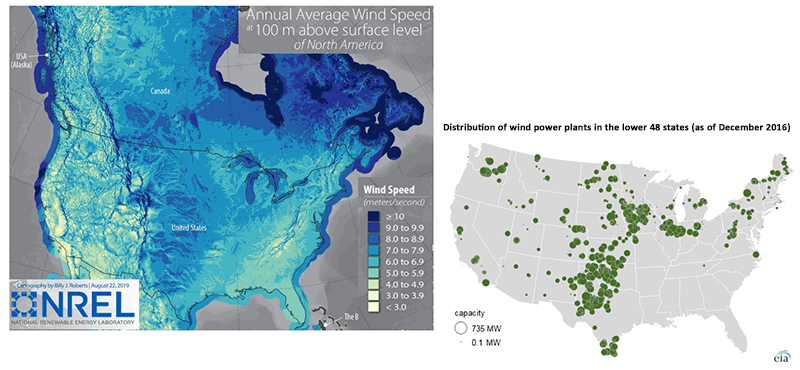
Third, due to reduced cost, installations such as wind power plants are doubling and redoubling to where current sources are more than 8% of US capacity.
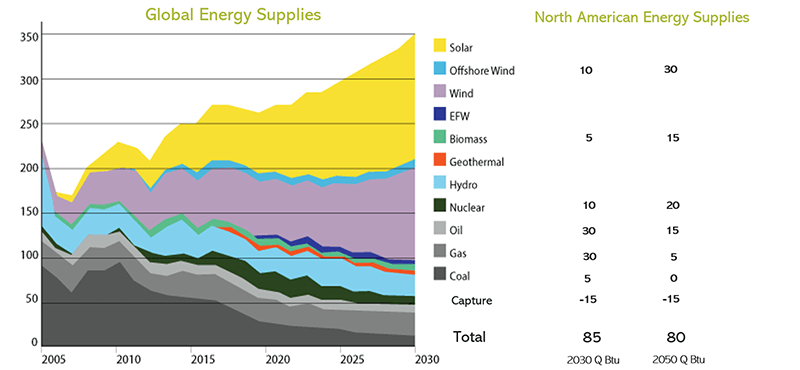
Supply and demand conditions will propagate clean energy by themselves, but still require a good risk management plan for leaving vital carbon resources in the ground.
This projection for global energy supplies from 2005 shows fossil fuel consumption dropping rapidly as renewable sources for energy ramp up. Above I have shown a scenario for North America, projecting to 2030 and 2050.
- efficiency improvements will continue to reduce consumption from over 100 quads in 2000 to 80 quads in 2050
- solar will continue to grow and become the largest energy source while coal phases out completely by 2030
- gas stays in the picture as a good source of variable electricity while phasing out its use as heating fuel
- nuclear, if we go out on a limb, could make a comeback in a fail-safe form
- oil remains the most efficient source of high-density transportation fuel, but these transportation emissions are offset by forest growth and carbon capture
- biomass from forest, agriculture, and waste management streams makes a resurgence past those pre-industrial levels
With the right plan, total carbon emissions could achieve net-zero, or neutral, by 2050.
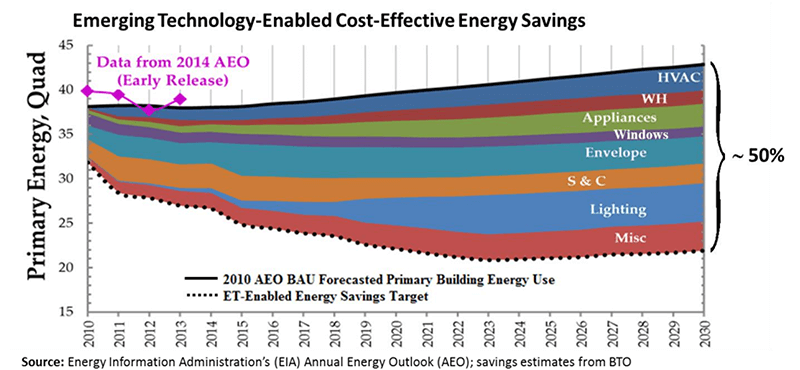
As low-cost electricity propagates through the built environment, there will be a new balance point of supply and demand. Price levels will determine complex interrelationships of savings and consumption.
This graph illustrates various tracks for savings and consumption. Business as usual growth in building energy could track steadily up over the 40 Quad level in the 20 years from 2010 to 2030. Countering that rise, increased efficiency across a broad range of building systems could save 50%, in the 20 Quad range, and equal to the savings we were looking for.
Many of these savings will happen as low cost, high efficiency technologies develop. Others will require tradeoffs between higher first cost/lower life cycle cost analysis.
At Vermeulens, we can help by putting construction cost numbers against these design elements, but the real heroes are the engineering wizards who create these technologies. For a deeper analysis of these engineering solutions, please follow our series of Trends for 2021 – HVAC.


