Market Outlook Quarterly Q2 2023

- Ongoing increases raised interest rates to 5.25% in May along with continued quantitative tightening. This has caused a decrease in interest rate-sensitive sectors such as residential construction. For insight into central bank policy go to FedWatch Q2 2023 - Another Growth Recession? from our affiliate, Green at No Cost
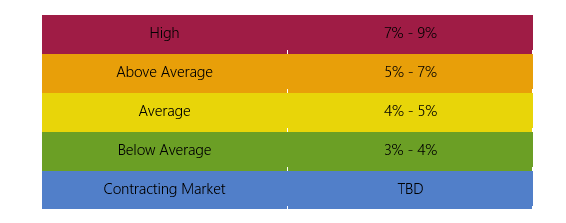
- Short-term construction price inflation is forecast to continue at 9% tapering toward 6% for 2023, 5% for 2024, then settling to a long-term average of 4%
- Volatility is declining. We now recommend bidding contingencies in the 0 to 10% range for projects bidding in the near term
- Vermeulens Index of Nonresidential Construction Prices rose in Q2 of 2023 at 0.75% per month
- Supply Chain Shortages, labor shortages, and increased backlogs have impacted bid prices. However, supply chain improvements and fear of recession have reduced the cost impact of these factors
- Architectural Billings went up slightly in May and June but continued down by the end of June
- Construction Dollar Volume: Residential construction went up in Q2 by 3.80%; Nonresidential construction is up 31.2% year to year; and Infrastructure spending decreased 0.08% in Q2. For insight into growth trends in these sectors go to Sectoral Watch from our affiliate, Green at No Cost. For more information on renewable energy and what it means for construction, please visit Industrial Revolution Redux our affiliate, Green at No Cost
- Construction Job Growth: approximately 62,000 construction jobs were added in Q2, or +0.79%; construction employment is now 3.7% above pre-pandemic levels
- The New York Stock Exchange has increased by 9.58% year over year but remains below its prior peak
- Total Employment Growth through Q2 was 228,000 average per month, well above recession levels
- Gross Domestic Product: growth for 2023 was 2.39%. Q2 2023 increased to an annual rate of 2.56%
- Commodity prices continue to decline to long-term averages
Fed Watch
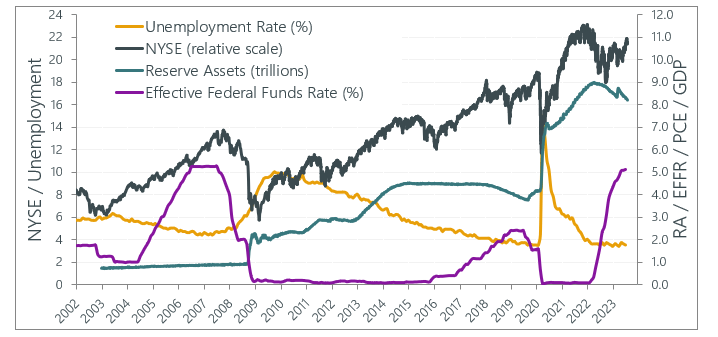
Inflation and Employment Targets propel monetary policy, and subsequently construction prices. Ongoing increases raised interest rates to 5.25% in May along with continued quantitative tightening. This has caused a decline in interest rate-sensitive sectors such as residential construction.
Go to Another Growth Recession? from our affiliate, Green at No Cost
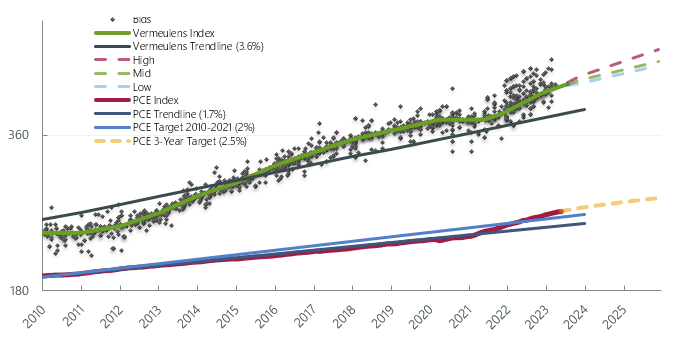
Vermeulens Construction Cost Index
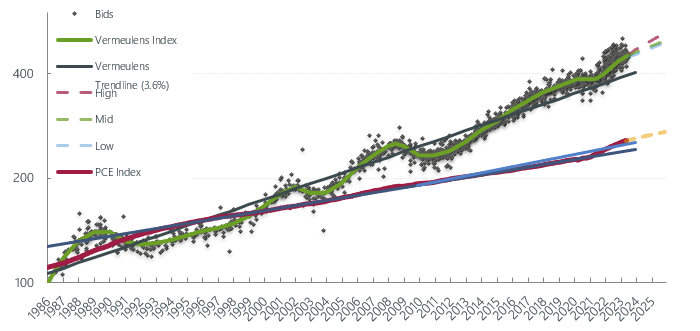
Prices for Q2 2023 nationally increased 0.75% monthly as contractor backlogs filled and labor/material shortages continued.
For the past 37 years, nonresidential construction prices trended at a 3.6% annually compounded escalation rate. The rate of escalation seen in construction costs relates to the target of 2% annual inflation for consumer prices and the monetary policy used to achieve this goal. Consumer inflation has increased rapidly above the long-term target of 2%.
In contrast to previous financial recessions, strong and immediate fiscal and monetary measures countered the collapse in activity at the outset of the pandemic. 2022 saw these measures reversing due to the overwhelming strength of major indicators. 2023 is continuing measures to moderate prices and employment indicators.
Vermeulens Index tracks bid prices for nonresidential construction projects relative to the average represented by Vermeulens Trendline. The Personal Consumption Expenditures Index tracks general prices relative to PCE Trendline and PCE Target. Strength in nonresidential construction point to short term cost increases of 0.75% per month, and a continuing increase in the long term Vermeulens Trendline toward 4%.
AIA Billings
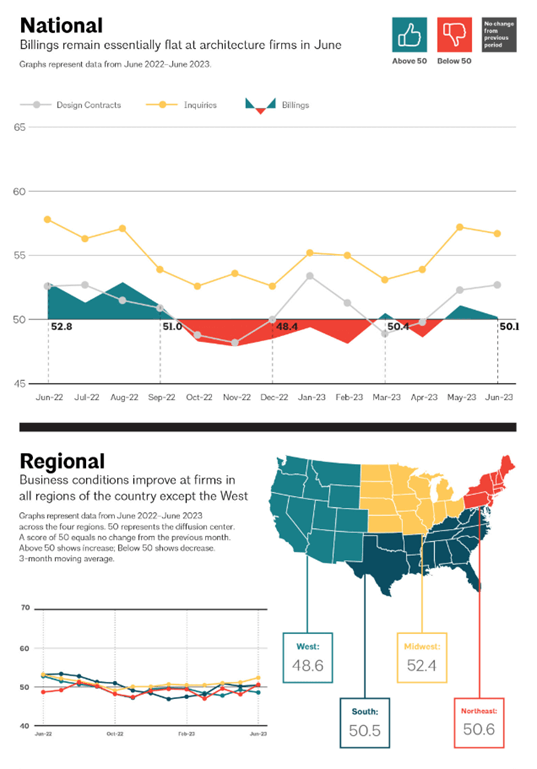
Architectural Billings are a leading indicator for future construction volume. A score greater than 50 indicates growth. Design fee billings typically indicate construction volume 9 - 12 months in advance.
Architectural Billings went up slightly in May and June but continued down until the end of June.
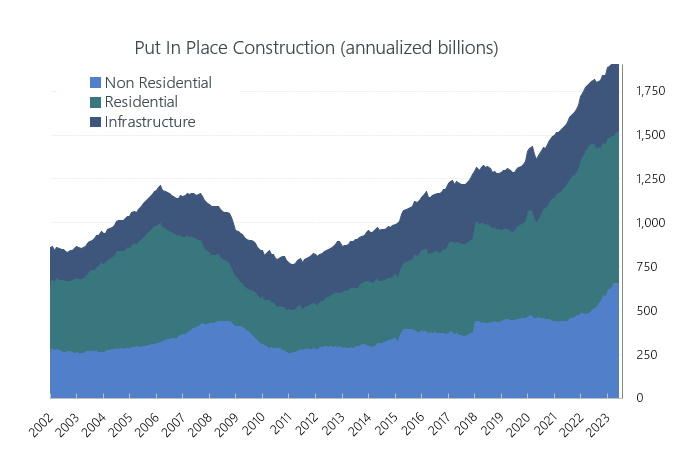
Put In Place Construction
Construction Dollar Volume grew by 1.60% in Q2, posting a 7.5% year over year increase (June 22/June 23). Construction dollar volume is the main driver of construction prices.
Residential dollar volume increased 3.80% in Q2, decreasing year over year by 8.5% (June 22/June 23).
Nonresidential spending is up 31.2% year over year (June 22/June 23). Improved backlogs, attrition, and shortages are driving price increases in this sector.
Infrastructure spending decreased 0.08% in Q2 2023, with a 16.3% year over year increase (June 22/June 23).
Federal infrastructure spending will increase over the next 10 years.
Read Fiscal Watch Vermeulens Market Outlook Blog for an impact assessment of new programs.
http://www.census.gov/construction/c30/c30index.html
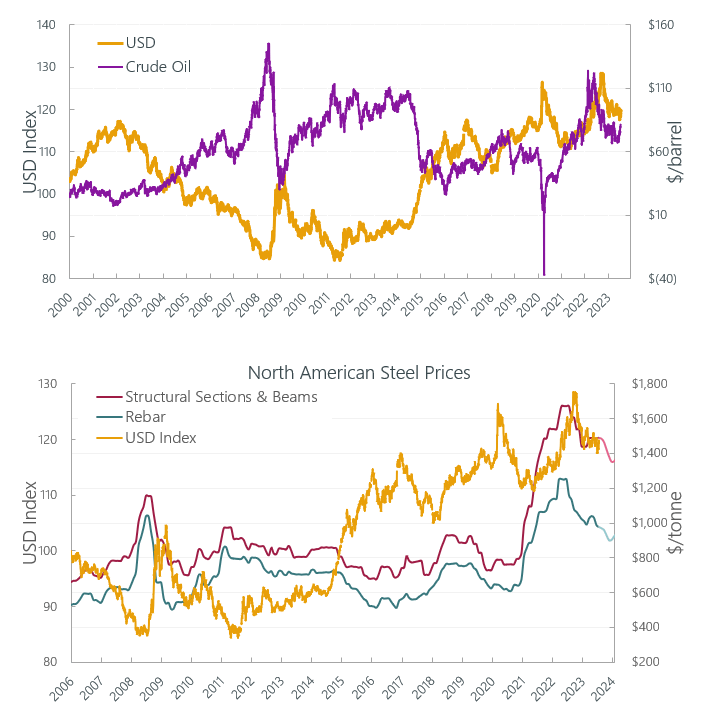
Commodity Prices
Supply chain shortages, labor shortages, and increased backlogs are impacting bid prices. However, the supply chain and fear of recession have reduced the cost impact of these factors.
Crude Oil reduced to $70.66 per barrel at the end of June 2023 from its peak of $123.64. Prices were volatile throughout the last quarter, peaking at $83.26 on April 12th. Structural sections and beams increased 0.13% and rebar is down by 3.70% since March 2023.
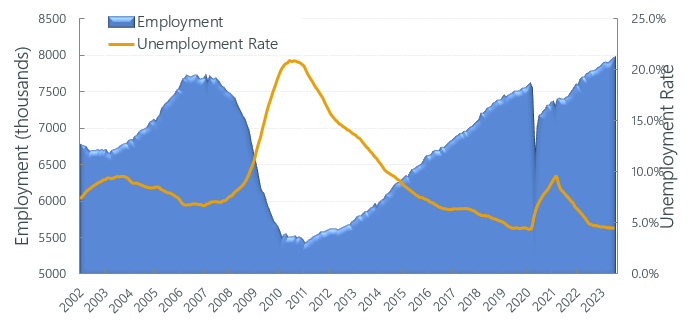
Construction Labor Market
Construction Unemployment at the end of Q2 sits at 4.5% (12-month average), down from 5.6% at the end of Q1 2023, reflecting lower growth in total construction dollar volume.
Construction Job Growth was 62,000 or 0.79%, this quarter. Wage and profit increases in the nonresidential sector will draw new entrants, as well as restructuring from the residential sector and other sectors of the economy. Labor growth is likely to continue its steep rise as selling prices in the sector outperform other industries.
Construction Labor Force Growth Rate
Construction Labor Force Growth Rate is calculated by the current 12-month average in construction employment relative to previous 12-month average in construction employment.
Total Jobs and Market Performance
Monthly Average Job Growth for the US economy through Q2 was 228K peaking in May with 281k before falling to 185k in June.
The chart below removes short-term fluctuations in job growth by looking at a 6-month moving average. The size of the labor force grows at 100,000 per month due to population increase. Sustained periods of recession, where job creation remains below 100,000 jobs per month, have accompanied dips in construction prices as illustrated by the red bars below.
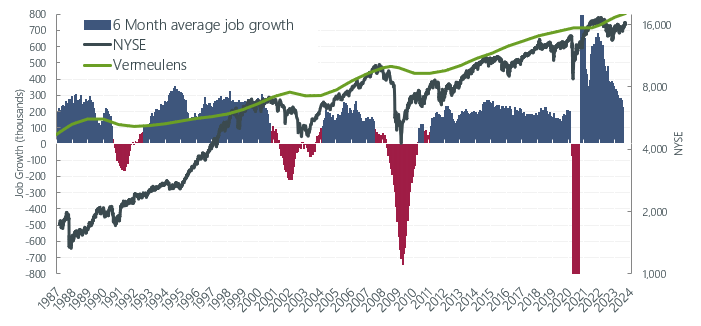
https://data.bls.gov/timeseries/CES0000000001
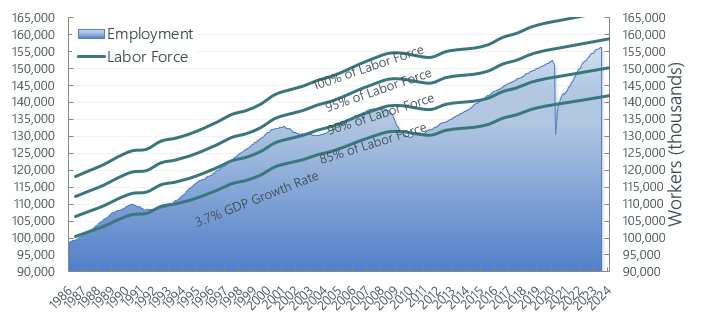
Employment Percentage of Total Workforce
Total Employment as a percentage of total workforce continued its recovery reaching more than 94% at the end of Q2 2023.
The chart below shows total employment as a percentage of the US workforce. The Federal Reserve will accommodate growth to maximize employment. Both the size of the labor force and participation rates are at play. Labor force growth has not kept pace with employment opportunities, resulting in shortages.
Forecast - National Trend
Nonresidential Construction prices continued to rise in 2023 at 0.75% per month as they did through 2022. Contractor backlogs, strong margins, increased labor costs, and volatility in supply prices contributed to these rates. Short term construction price inflation is forecast to continue at 9% tapering toward 6% for 2023, moderating to 5% for 2024, then settling to a long-term average of 4%. This aligns with Federal Reserve estimates for inflation of 5.6% for 2022, 3.6% this year, 2.5% in 2024, and 2.1% in 2025.
Volatility is declining. We now recommend bidding contingencies in the 0 to 10% range for projects bidding in the near term.
“A noticeable slowdown in growth starting later this year” is expected to continue to moderate construction prices.
Vermeulens strives to give our clients the greatest possible value and results for their projects. If you:
Need any help with your projects,
Want to set up a presentation to your group,
Would like to meet to see how we can help your team, and expand our business together,
Are looking for company information,
Please contact: Marisol Serrao, Principal, at 617 263 8879 or mserrao@vermeulens.com.

Richard Vermeulen
Senior Principal

Blair tennant
Senior Principal

Joshua Silverman
Senior Project Manager