Market Outlook Quarterly Q3 2023
Vermeulens’ Market Reports are based on actual bid prices in the Nonresidential Construction Industry. Forecasts are based on leading indicators and historical comparative analysis.
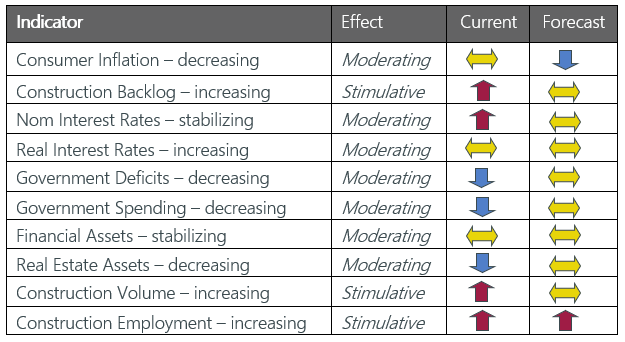
- Fed Funds Rate: After increasing to 5.5% we may have reached a peak as inflation slows
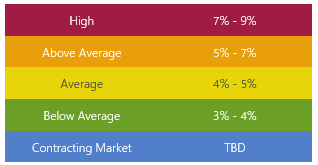
- Price Inflation: Short-term construction costs are forecasted to be 4% - 6% for 2024
- Volatility Declining: We are recommending a reduction or elimination of bidding contingency in most markets
- Vermeulens Index: Nonresidential Construction Prices increased at a rate of 5% per month in Q3
- Architectural Billings: 12 consecutive months of declines may indicate a slowing in future construction volume
- Construction Dollar Volume:
- residential construction increased 2.2% in Q3
- nonresidential construction is up 34% year over year
- infrastructure spending increased 0.47% in Q3
- Construction Jobs: 59,000 construction jobs were added in Q3; currently 5.1% above pre-pandemic levels
- New York Stock Exchange: 14.3% increase year over year but remains below its prior peak
- Employment: Q3 job growth averaged 266,000 average per month, well above recession levels
- GDP: Growth for Q3 2023 was 4.9%; housing activity and fixed investment remain well below 2022
- Commodity prices continue to decline to long-term averages and buying power is returning in the steel market
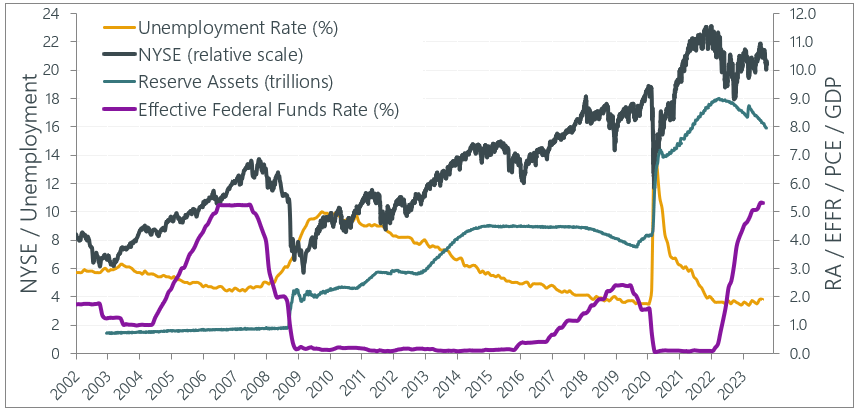
Fed Watch
Inflation and Employment Targets propel monetary policy, and subsequently construction prices. Ongoing increases in interest rates to 5.5% along with $1 trillion quantitative tightening, have caused a decline in interest rate-sensitive sectors such as residential construction. Unemployment remains at historic lows.
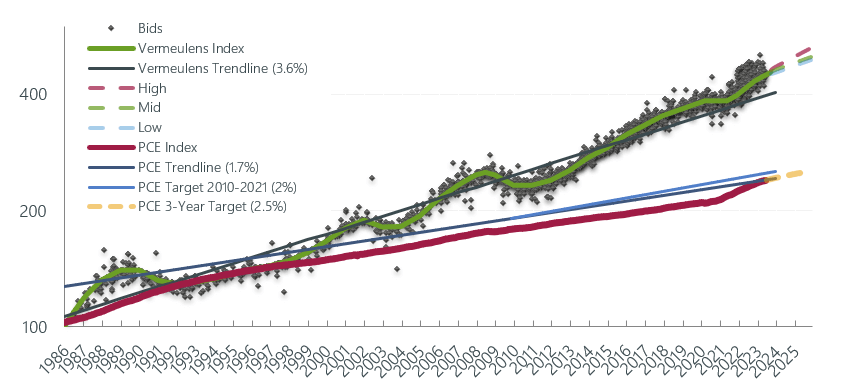
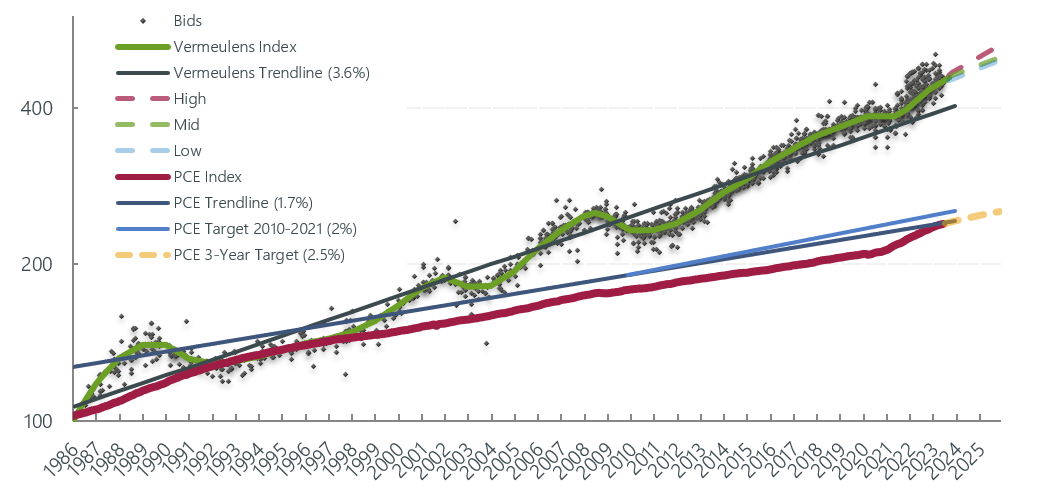
Vermeulens Construction Cost Index
Nonresidential construction prices for Q3 2023 nationally increased 0.5% monthly as contractor backlogs filled, and labor/material shortages continued.
Bid prices for nonresidential construction projects are shown relative to the average represented by Vermeulens Trendline. Personal consumption prices are tracked relative to PCE Trendline and PCE Target.
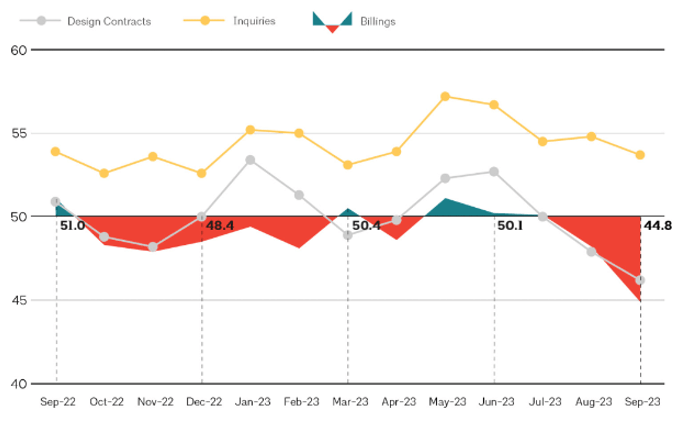
AIA Billings
Architectural Billings are a leading indicator for future construction volume. A score greater than 50 indicates growth. Design fee billings typically indicate construction volume 9 - 12 months in advance.
Architectural Billings has been declining or near declining for 12 consecutive months.
Put In Place Construction
Construction dollar volume is the main driver of construction prices.
Total volume grew by 1.39% in Q3, posting a 10% year-over-year increase (August 22/August 23).
Residential dollar volume increased 2.2% in Q3, decreasing year over year by 6% (August 22/August 23). Lack of activity is indicating lower costs for labor and material inputs in this sector.
Nonresidential spending is up 34% year over year (August 22/August 23). Improved backlogs, attrition, and shortages are driving price increases in this sector.
Infrastructure spending increased 0.47% in Q3 2023, with an 18.6% year-over-year increase (August 22/August 23). Government spending on Infrastructure is expected to continue.
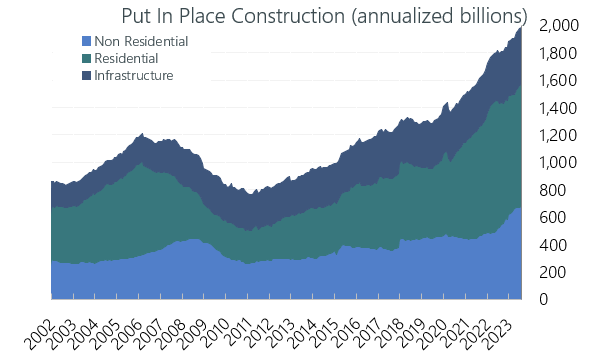
http://www.census.gov/construction/c30/c30index.html
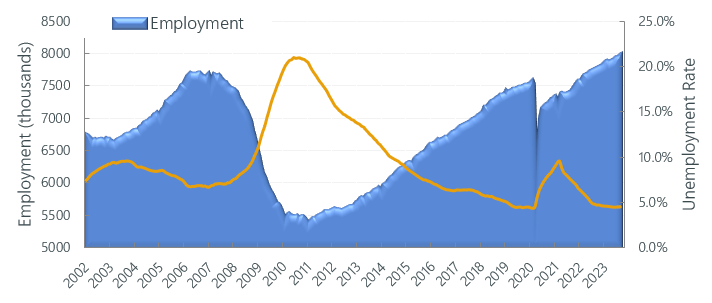
Construction Labor Market
Construction Unemployment at the end of Q3 sits at 3.8% (12-month average), up from 3.6% at the end of Q2 2023, reflecting lower growth in total construction dollar volume.
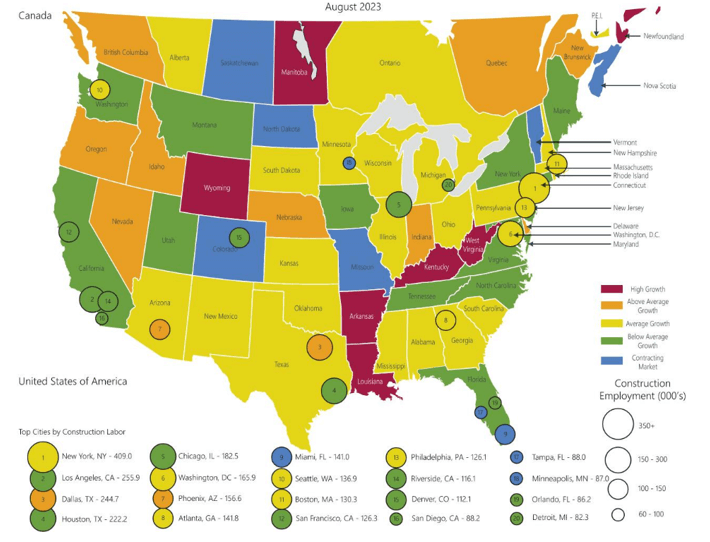
Construction Labor Force Growth Rate
Construction Labor Force Growth Rate is calculated by the current 12-month average in construction employment relative to the previous 12-month average in construction employment.
Total Jobs and Market Performance
Monthly Average Job Growth for the US economy through Q3 was 266K, peaking in September at 336K.
The chart below removes short-term fluctuations in job growth by looking at a 6-month moving average. The size of the labor force grows at 100,000 per month due to population increase. Sustained periods of recession, where job creation remains below 100,000 jobs per month, have accompanied dips in construction prices as illustrated by the red bars below.
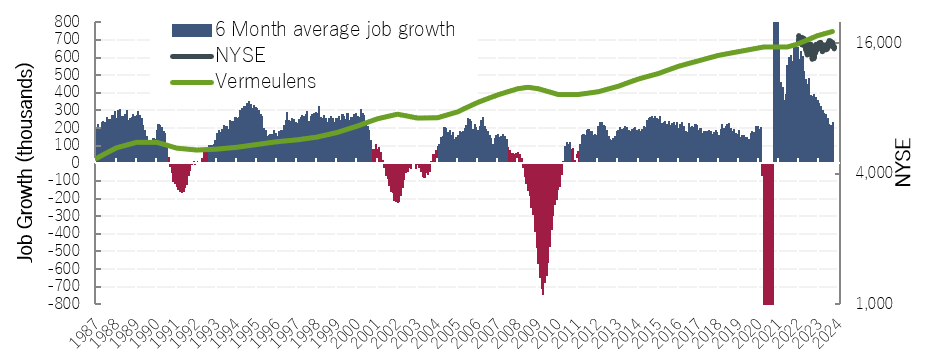
https://data.bls.gov/timeseries/CES0000000001
Forecast - National Trend
Nonresidential Construction prices continued to rise in 2023 at 0.5% per month as they did through 2022. Contractor backlogs, strong margins, increased labor costs, and volatility in supply prices contributed to these rates. As volume growth slows and monetary conditions tighten our forecast is 4 - 6% for 2024 settling to a long-term average of 4%. This aligns with Federal Reserve estimates for inflation of 5.6% for 2022, 3.6% this year, 2.5% in 2024, and 2.1% in 2025.
“A noticeable slowdown in growth starting later this year” is expected to continue to moderate construction prices.
For related content please visit our affiliate, Green At No Cost
If you:
Need any help with your projects,
Want to set up a presentation to your group,
Would like to meet to see how we can help your team, and expand our business together,
Are looking for company information,
Please contact: Marisol Serrao, Principal, at 617 263 8879 or mserrao@vermeulens.com.

Richard Vermeulen
Senior Principal

Blair tennant
Senior Principal

Joshua Silverman
Senior Project Manager