Market Outlook Quarterly Q4 - 2024
Market Outlook Quarterly Q4 2024

Vermeulens’ Market Reports are based on actual bid prices in the Nonresidential Construction Industry. Forecasts are based on leading indicators and historical comparative analysis.
- 15,000 construction jobs were added in Q4, 9.2% above pre-pandemic levels
- Dollar volume changes in Q4 indicate most jobs were added in the manufacturing sector (+15.7%) while office, commercial, healthcare, and educational spending decreased
- Commodity price inflation continues to decline to long-term averages. Buying power is returning in the copper and steel markets
- Volatility Declining: we are recommending a reduction or elimination of bidding contingency in some markets
Forecast - National Trend
Nonresidential Construction prices continued to rise in 2024 at 0.5% per month. As monetary conditions remain tight our forecast is 4 - 6% for 2024 settling to a long-term average of 4%. This aligns with Federal Reserve estimates for inflation of 5.6% for 2022, 3.6% for 2023, 2.5% in 2024, and 2.1% in 2025.
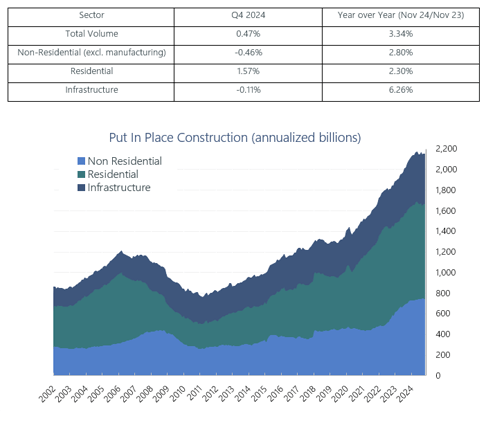
Put In Place Construction
Construction dollar volume is the main driver of construction prices. Total volume went up by 0.47% in Q4, and 3.34% annually (November 23/ November 24). This represents a deceleration of growth from 3.5% per quarter in 2023 to 0.6% in Q2 2024.
http://www.census.gov/construction/c30/c30index.html
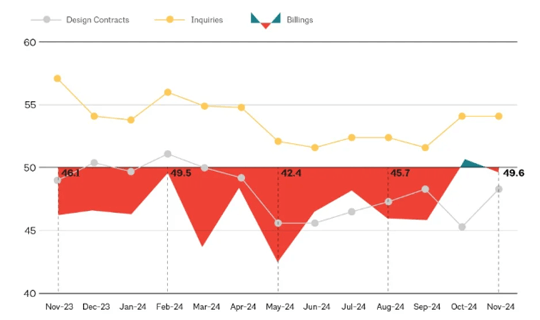
AIA Billings
Architectural Billings indicate slowing in future construction volume. Architectural Billings have been declining for 17 consecutive months. Poor indicators of future work accompanied by the smallest average backlog in the past 3 years are mitigated only by industry optimism in declining interest rates. A score greater than 50 indicates growth.
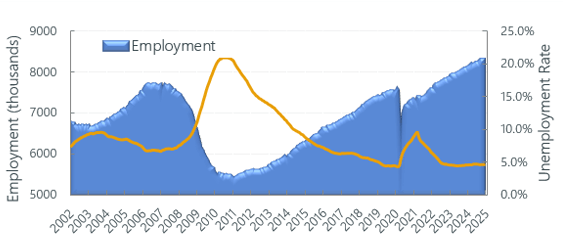
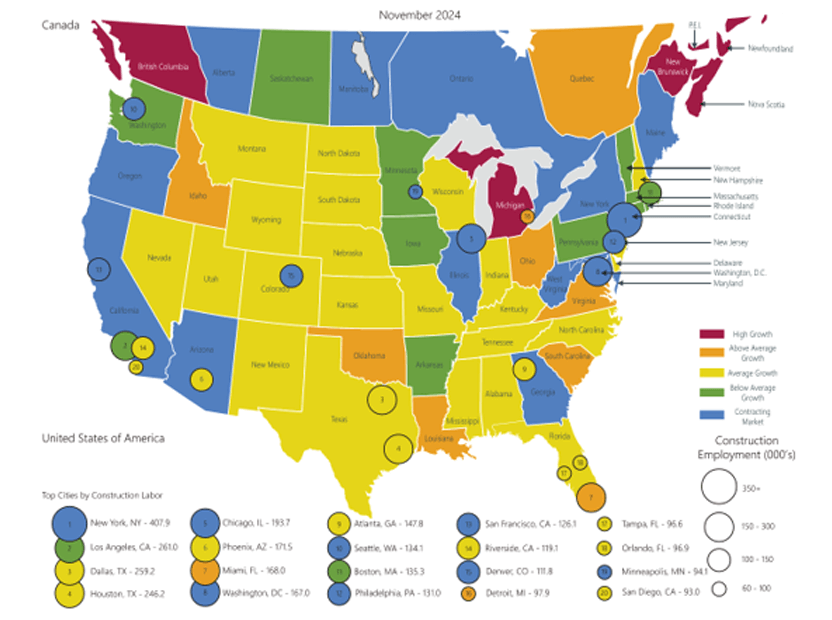
Construction Labor Market
Construction Unemployment in Q4 remains steady at 4.7% (12-month average), reflecting a slight increase but overall remaining low.
Construction Labor Force Growth Rate
Construction Labor Force Growth Rate is calculated by the current 12-month average in construction employment relative to the previous 12-month average in construction employment.
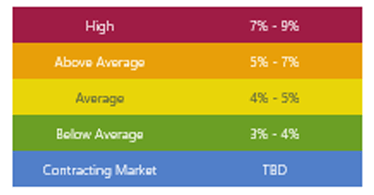
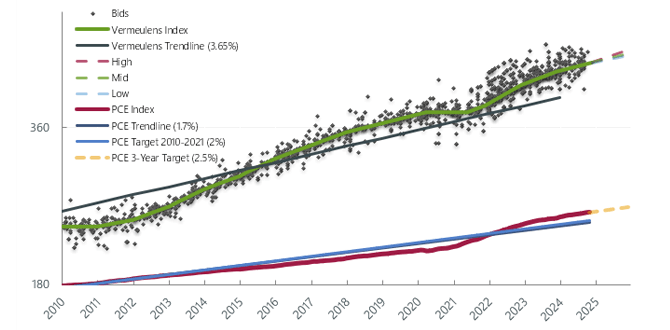
Vermeulens Construction Cost Index
Bid prices for nonresidential construction projects are shown relative to the average represented by Vermeulens Trendline. Personal consumption prices are tracked relative to PCE Trendline and PCE Target.
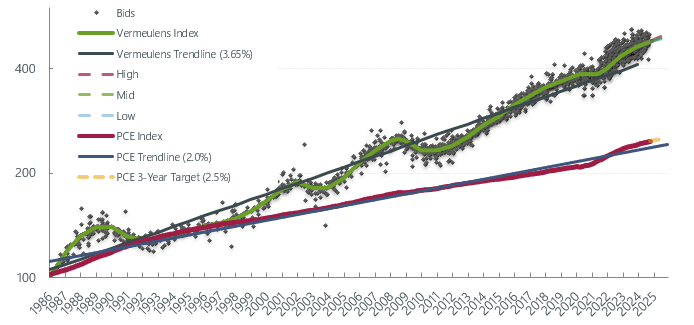
Total Jobs and Market Performance
Monthly Average Job Growth for the US economy through Q4 was 170,000/month.
The size of the labor force grows at a rate of 100,000 per month due to population increase. Sustained periods of recession, where job creation remains below 100,000 jobs per month, have accompanied dips in construction prices as illustrated by the red bars below.
https://data.bls.gov/timeseries/CES0000000001
Fed Watch
Inflation and Employment Targets propel monetary policy, and subsequently construction prices. Inflation has continued its downward trend averaging 2.6% for 2024. Along with $1 trillion quantitative tightening, growth has slowed in interest rate sensitive sectors such as residential construction. Unemployment remains at historic lows.
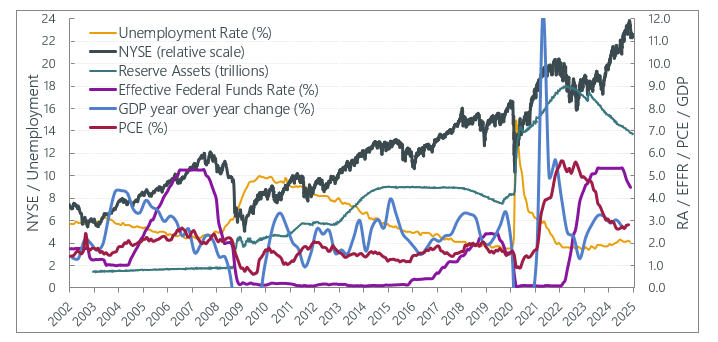
“…over the course of three previous meetings, we lowered our target range by a full percentage point from its peak. At today’s meeting, we decided to maintain our target range of 4.25 to 4.5%. Reducing restraint too fast could hinder progress on inflation” – FOMC Press Conference January 29, 2025.
New York Stock Exchange: increased 13.90% annually. GDP had a growth rate of 2% for 2024.

Richard Vermeulen
Senior Principal

Blair tennant
Senior Principal

Joshua Silverman
Associate