Market Outlook Quarterly Q1 2024

Vermeulens’ Market Reports are based on actual bid prices in the Nonresidential Construction Industry. Forecasts are based on leading indicators and historical comparative analysis.
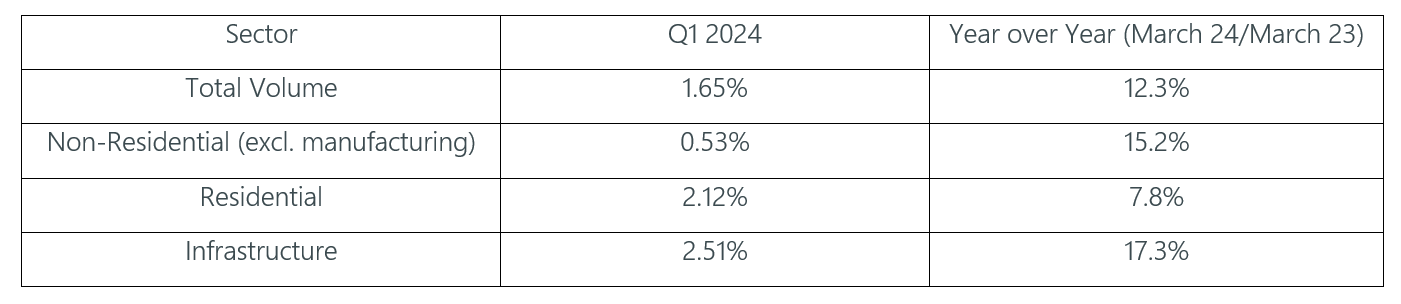
- 56,000 construction jobs were added in Q1, 7.7% above pre-pandemic levels. Based on dollar volume changes during Q1, most of the added construction jobs were in residential, infrastructure, and manufacturing
- Commodity prices continue to decline to long term averages and buying power is returning in the steel market
- Volatility Declining: we are recommending a reduction or elimination of bidding contingency in some markets
Forecast - National Trend
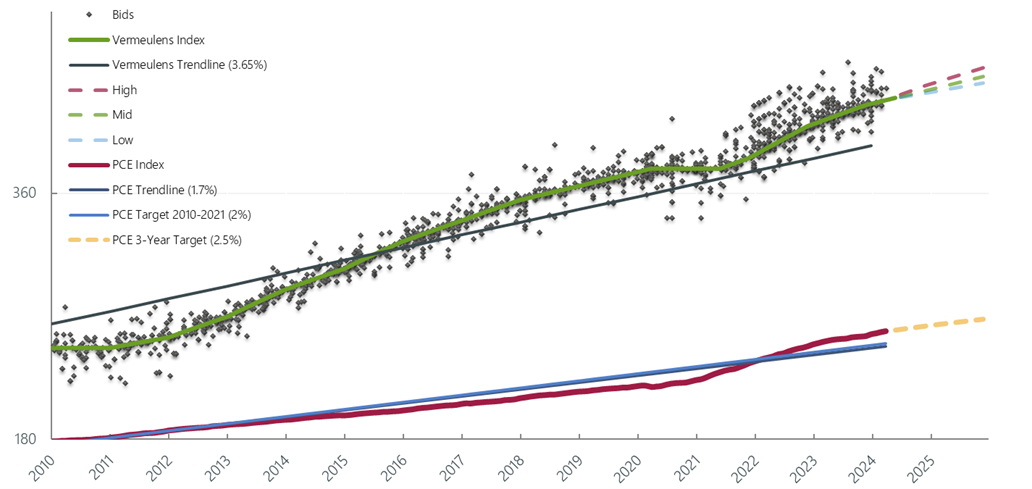
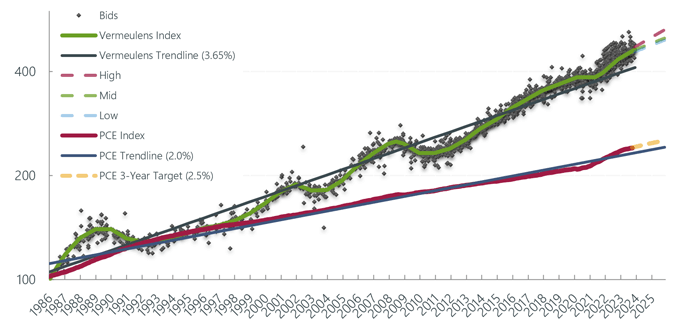
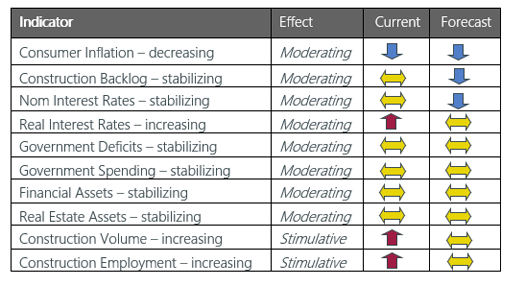
Nonresidential Construction prices continued to rise in 2024 at 0.5% per month. As monetary conditions remain tight our forecast is 4 - 6% for 2024, settling to a long-term average of 4%. This aligns with Federal Reserve estimates for inflation of 5.6% for 2022, 3.6% for 2023, 2.5% in 2024, and 2.1% in 2025.
Put In Place Construction
Construction dollar volume is the main driver of construction prices. Total volume went up by 0.02% in Q1, posting a 10.5% increase (March 23/March 24). This represents a rapid growth slowdown: 3.5%/quarter average in 2023 down to 0.02% in Q1 2024.
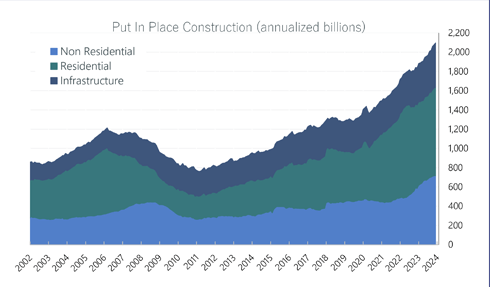
http://www.census.gov/construction/c30/c30index.html
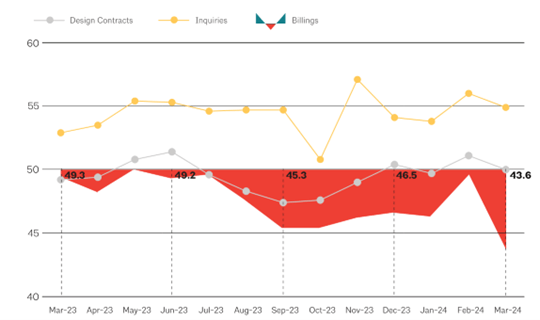
AIA Billings
Architectural Billings may indicate slowing in future construction volume. Architectural Billings have been declining or nearly declining for 14 consecutive months. Q1 showed substantial declines. “Firms are increasingly concerned about managing the costs of their firm in 2024.” A score greater than 50 indicates growth.
Construction Labor Market
Construction Unemployment at the end of Q1 sits at 4.6% (12-month average), equal to 4.6% at the end of Q4 2023, reflecting lower growth in total construction dollar volume.
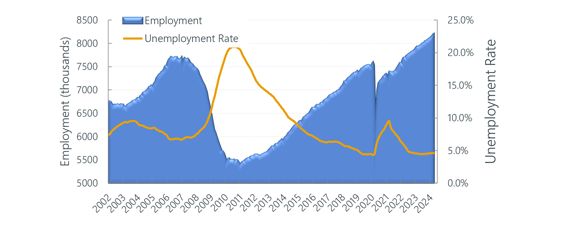
Construction Labor Force Growth Rate
Construction Labor Force Growth Rate is calculated by the current 12-month average in construction employment relative to previous 12-month average in construction employment.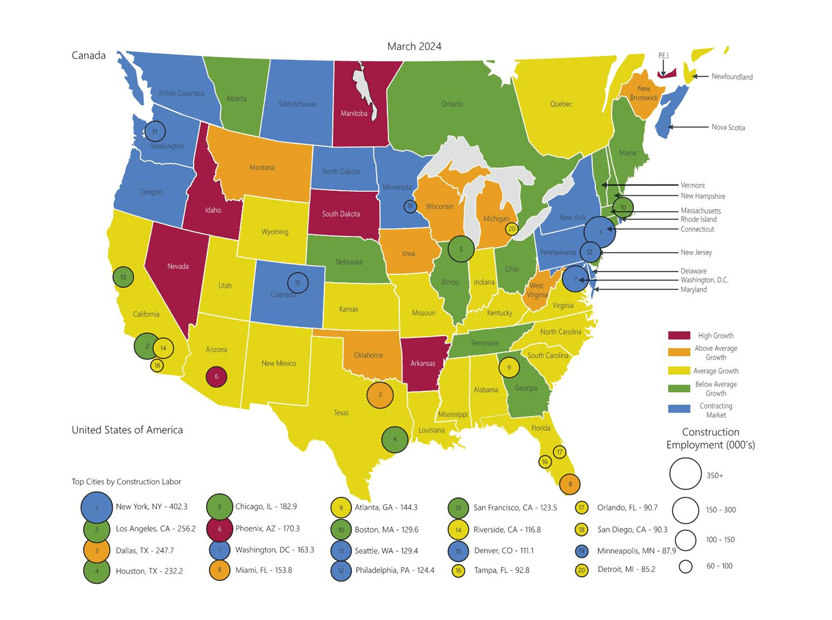
Vermeulens Construction Cost Index
Bid prices for nonresidential construction projects are shown relative to the average represented by Vermeulens Trendline. Personal consumption prices are tracked relative to PCE Trendline and PCE Target.
Total Jobs and Market Performance
Monthly Average Job Growth for the US economy through Q1 was 269K, peaking in March at 315K.The size of the labor force grows at a rate of 100,000 per month due to population increase. Sustained periods of recession, where job creation remains below 100,000 jobs per month, have accompanied dips in construction prices as illustrated by the red bars below.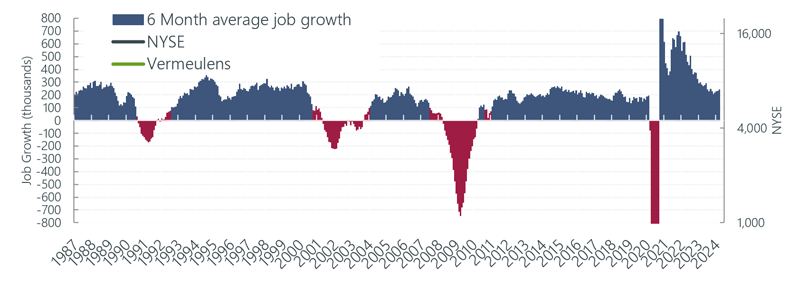
https://data.bls.gov/timeseries/CES0000000001
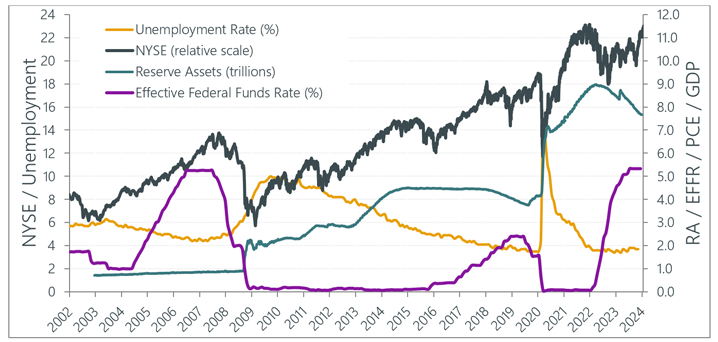
Fed Watch
Inflation and Employment Targets propel monetary policy, and subsequently construction prices. Ongoing increases of interest rates to 5.3% along with $1 trillion quantitative tightening, has caused a decline in interest rate sensitive sectors such as residential construction. Unemployment remains at historic lows.

Richard Vermeulen
Senior Principal

Blair tennant
Senior Principal

Joshua Silverman
Associate