Market Outlook Quarterly Q4 2022

-
Ongoing increases raised interest rates to 4.25% in December along with continued quantitative tightening. This has caused a decrease in interest rate sensitive sectors such as residential construction
-
Medium term construction price inflation is forecast to continue at 9% before settling toward 6% for 2023, 5% for 2024, then settling to a long-term average of 4%
-
Volatility remains high. We continue to recommend additional bidding contingencies in the 5 to 15% range
-
Construction Prices rose in Q4 of 2022 at 0.75% per month
-
Supply Chain Shortages, labor shortages, and increased backlogs are impacting bid prices. However, the supply chain and fear of recession have reduced the cost impact of these factors
-
Architectural Billings and contracts declined for the whole Q4
-
Construction Dollar Volume: residential construction decreased in Q4; nonresidential construction is up 17.7% annually, and infrastructure spending increased 1.44% this quarter
-
Construction Job Growth: approximately 56,000 construction jobs were added in Q4, or +0.73%; construction employment is now 2.0% above pre-pandemic levels
-
New York Stock Exchange has dropped 11.53% year over year
-
Total Employment Growth through Q4 was 247,000 average per month, well above recession levels
-
Gross Domestic Product: GDP dropped from Q1 2022 to Q2. GDP in Q4 2022 increased by 0.72% from Q3
-
Commodities continue to put cost pressure on prices but show signs of moderating
Fed Watch
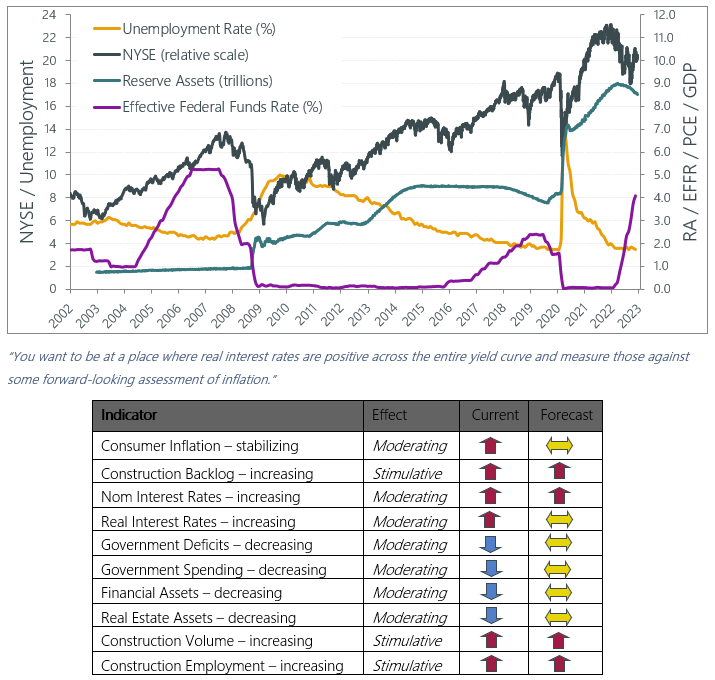
Inflation and Employment Targets propel monetary policy, and subsequently construction prices. Ongoing increases raised interest rates to 4.25% in December along with continued quantitative tightening. This has caused a decline in interest rate sensitive sectors such as residential construction.
“In this cycle, longer run inflation expectations have been well anchored. To the extent that this continues, that should make it easier to restore price stability. Also, different this time, is that part of this inflation is caused by supply shocks, beginning with the pandemic, then with the opening of the economy, then with Russia’s invasion of Ukraine.”
https://www.federalreserve.gov/mediacenter/files/FOMCpresconf20221214.pdf
Vermeulens Construction Cost Index
Price increases for Q3 and Q4 2022 nationally increased to 0.75% monthly as contractor backlogs filled, and labor/material shortages continued.
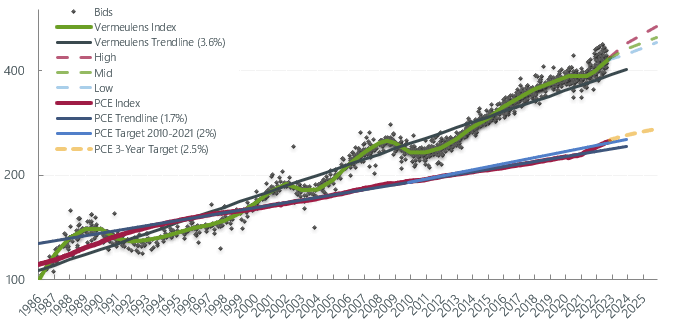
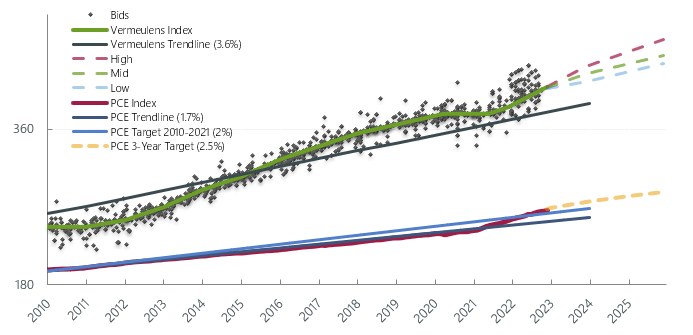
For the past 37 years, nonresidential construction prices trended at a 3.6% annually compounded escalation rate. The rate of escalation seen in construction costs relate to the target of 2% annual inflation for consumer prices and the monetary policy used to achieve this goal. Consumer inflation has increased rapidly above the long-term target of 2%.
In contrast to previous financial recessions, strong and immediate fiscal and monetary measures countered the collapse in activity at the outset of the pandemic. 2022 saw these measures reversing due to the overwhelming strength of major indicators.
Vermeulens Index tracks bid prices for nonresidential construction projects relative to the average represented by Vermeulens Trendline. Personal Consumption Expenditures Index tracks general prices relative to PCE Trendline and PCE Target. Strength in nonresidential construction point to short term cost increases of 0.75% per month, and a continuing increase in the long term Vermeulens Trendline toward 4%.
AIA Billings
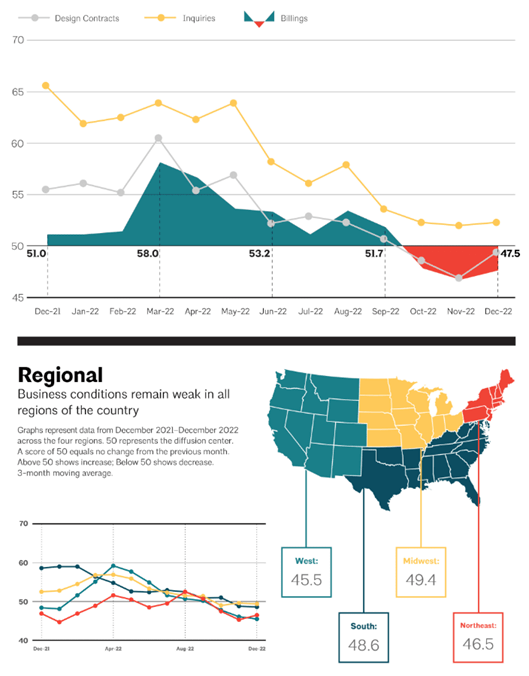
Architectural Billings are a leading indicator for future construction volume. A score greater than 50 indicates growth. Design fee billings typically indicate construction volume 9 - 12 months in advance.
Architectural billings declined last quarter. The value of new signed design contracts also fell while inquiries grew slightly. https://www.aia.org/pages/6587696-abi-december-2022-architecture-firm-billin
Put In Place Construction
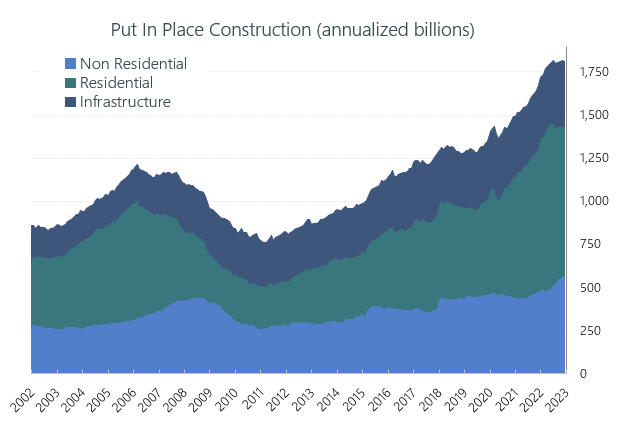
Construction Dollar Volume grew by 0.13% in Q4, posting an 8.5% year over year increase (Dec 21/Dec 22). Construction dollar volume is the main driver of construction prices.
Residential dollar volume declined 2.56% in Q4, increasing year over year by 3.6% (Dec 21/Dec 22).
Nonresidential spending is up 17.7% year over year (Dec 21/Dec 22). Improved backlogs, attrition, and shortages are driving price increases in this sector.
Infrastructure spending increased 1.44% in Q4 2022, with a 7.5% year over year change (Dec 21/Dec 22). Federal infrastructure spending will increase over the next 10 years. See https://vermeulens.com/blog/fiscalwatch for an impact assessment of new programs.
“The interest sensitive parts of the economy are certainly showing the effects of our tightening. Housing is seeing declining activity and house prices are moving down. Through exchange rates we are having an effect on imports and exports.”
https://www.federalreserve.gov/mediacenter/files/FOMCpresconf20220921.pdf
http://www.census.gov/construction/c30/c30index.html
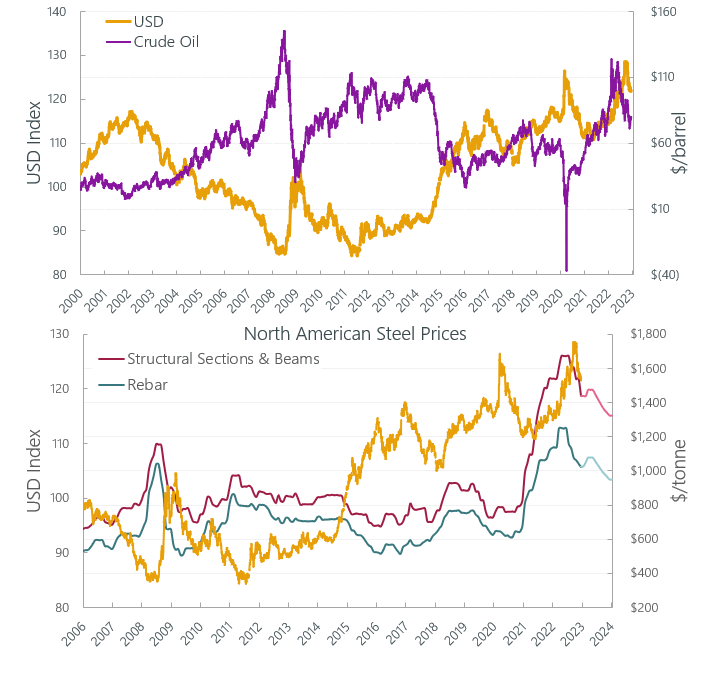
Commodity Prices
Supply chain shortages, labor shortages, and increased backlogs are impacting bid prices. However, the supply chain and fear of recession have reduced the cost impact of these factors.
Crude Oil reduced to $80.16 per barrel at the end of December 2022 from its peak of $123.64. Prices were volatile throughout last quarter, peaking at $93.07 on October 7th. Structural sections and beams decreased 10.3% and rebar is down by 5.10% since September 2022.
“Supply chain events are not really part of business cycles, and we do see some evidence of stability. Commodity prices look like they might have peaked for now.”
https://www.federalreserve.gov/mediacenter/files/FOMCpresconf20220921.pdf
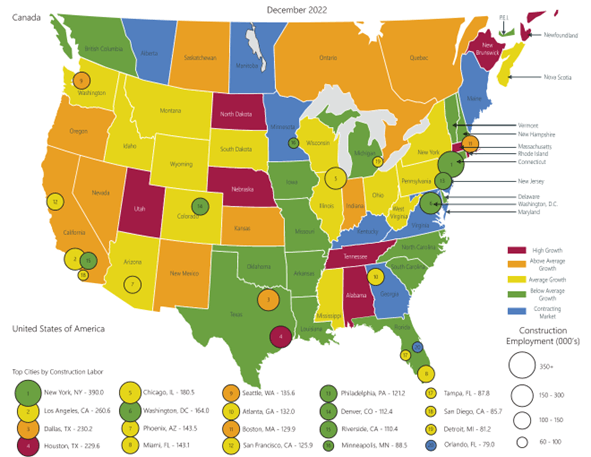
Construction Labor Market
Construction Unemployment at the end of Q4 sits at 4.6% (12-month average), down from 4.7% at the end of Q3, reflecting a lack of increase in labor supply.
Construction Job Growth was 56,000 or 0.73%, this quarter. Wage and profit increases in the non-residential sector will draw new entrants, as well as restructuring from the residential sector and other sectors of the economy. Labor growth is likely to continue its steep rise as selling prices in the sector outperform other industries.
Construction Labor Force Growth Rate
Construction Labor Force Growth Rate is calculated by the current 12-month average in construction employment relative to previous 12-month average in construction employment.
Total Jobs and Market Performance
Monthly Average Job Growth for the US economy through Q4 was 247K peaking in October with 269k before falling to 223k in December.
“There is modest evidence that the labor market is cooling off. Job openings are down a bit, quits are off their all-time highs; wage measures may be flattening; payroll gains have moderated but not much.
It’s plausible that job openings will come down significantly without much increase in unemployment as has happened in earlier historical episodes.”
https://www.federalreserve.gov/mediacenter/files/FOMCpresconf20220921.pdf
The chart below removes short-term fluctuations in job growth by looking at a 6-month moving average. The size of the labor force grows at 100,000 per month due to population increase. Sustained periods of recession, where job creation remains below 100,000 jobs per month, has accompanied dips in construction prices as illustrated by the red bars below.
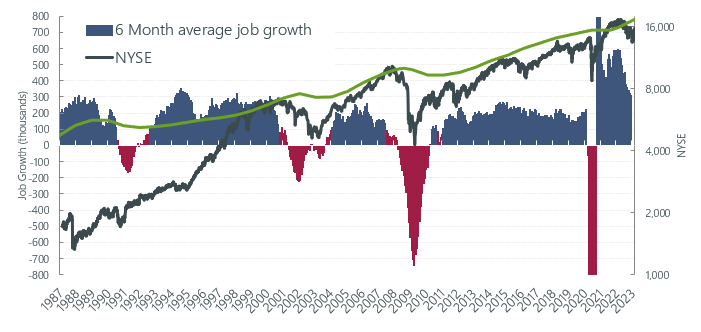
https://data.bls.gov/timeseries/CES0000000001
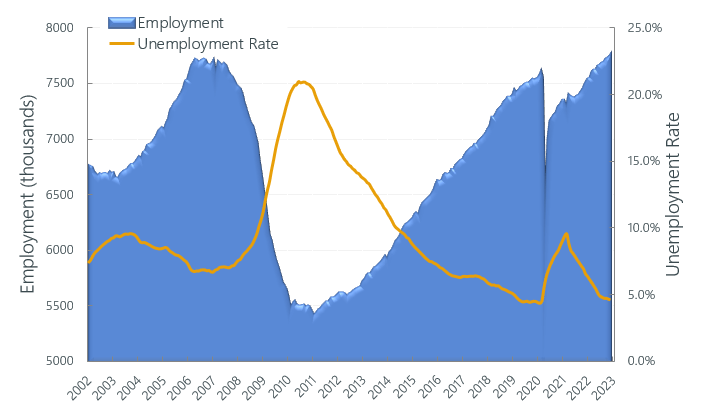
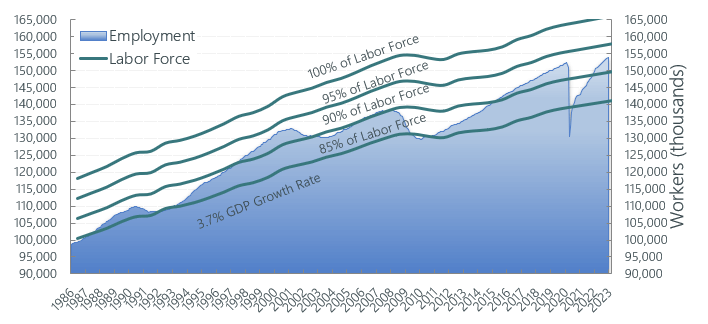
Employment Percentage of Total Workforce
Total Employment as a percentage of total workforce continued its recovery reaching more than 92% at the end of Q4 2022.The chart below shows total employment as a percentage of the US workforce. The Federal Reserve will accommodate growth to maximize employment. Both the size of the labor force and participation rates are at play, as we have seen in recent months, where labor force growth has not kept pace with employment opportunities, resulting in shortages. See Vermeulens’ blog, The Feds New Normal, for more analysis of employment and labor force factors.
“The chances of a soft landing are likely to diminish to the extent that policy needs to be more restrictive or restrictive for longer. Our labor force should be 3.5 million more than it is. People dropped out and slow to come back. Migration has been lower. Close to half a million died from COVID.”
https://www.federalreserve.gov/mediacenter/files/FOMCpresconf20221214.pdf
Forecast - National Trend
Nonresidential Construction prices rose in 2022 at 0.75% per month following a 0.5% per month rate in the second half of 2021. Contractor backlogs, strong margins, increased labor costs, and upward volatility in supply prices contributed to these rates. Medium term construction price inflation is forecast to continue at 9% before settling toward 6% for 2023, 5% for 2024, then settling to a long-term average of 4%. This aligns with Federal Reserve estimates for inflation of 5.6% for 2022, 3.1% this year, 2.5% in 2024, and 2.1% in 2025.
Volatility remains high. We continue to recommend additional bidding contingencies in the 5 to 15% range.
“By slowing the economy, and some softening in the labor market, and a big contribution from supply-side improvements, (we could achieve inflation objectives without negative economic growth and sustained job losses).”
https://www.federalreserve.gov/mediacenter/files/FOMCpresconf20220921.pdf
Vermeulens strives to give our clients the greatest possible value and results for their projects. If you:
Need any help with your projects,
Want to set up a presentation to your group,
Would like to meet to see how we can help your team, and expand our business together,
Are looking for company information,
Please contact: Marisol Serrao, Principal t at 617 263 8879 or mserrao@vermeulens.com.

Richard Vermeulen
Senior Principal

Blair tennant
Senior Principal

Joshua Silverman
Senior Project Manager