Tariffs assesment
Assessing Tariffs and Other Economic Impacts on the United States Construction Industry

Contents
- Executive Summary
- Recommendations
- Cost Drivers
- About Us
- Preface
- Law of Supply and Demand
- Steel
- Aluminum
- Energy
- Tariff Impact on Construction Cost
- Tariff Impact on the United States Economy
- Fiscal Policy Impact
- Monetary Policy Impact
- Construction Labor
- Industry Competition
- Input Index vs. Output Index
- Summary
- Case Study: Structural Steel Rates
- Appendix A
Executive Summary
Economic uncertainty and disruptive change are causing more concern and volatility in an already turbulent construction industry. Since 2020, construction costs have increased by 40% on average in the United States (cite reference: Vermeulens). On the surface a 25% global tariff on steel and aluminum imports to the United States may seem substantial, however our findings in this report indicate a minor impact on the bottom line of construction to be 1% to 2% when considering steel and aluminum only in the short-term. Factoring for retaliatory tariffs, reciprocal tariffs, and changes in demand this could deepen the impact to 3% to 4% for construction in the short-term.
Medium and long-term impacts on construction costs have significantly more variables to consider; continued tariff increases due to a ‘trade war,’ monetary policy, fiscal policy, labor markets, and general supply and demand economics. To further complicate the analysis, construction costs are uniquely volatile due to the vast range of inputs and highly subjective net/gross margins. Construction costs do not escalate in the same manner as the global economy does and ultimately the competition in the market drives cost.
In summary, the following ranges are Vermeulens’ outlook for potential cost increases in the United States construction market.
- near-term construction projects: should expect 1% to 2% cost increases due to tariffs in busy to moderate construction markets
- mid to long-term projects in busy construction markets: should expect an additional 1% to 2% (2% to 4% total) due to other economic drivers outlined in this paper
- labor costs: will shift along with demand for construction and may see a decline in some markets and up to +6% increases in other markets
- competition for work: will determine how much if any of these cost increases are passed on to owners
Recommendations
- slow construction markets: may experience negligible construction cost increases do to heightened competition
- busy construction markets: may experience a 10% cost increase in the medium to long-term
- total impact: 0% to 2% immediately, an additional 1% to 2% over 2025, 0% to 6% in the labor market = 0% to 10% depending on the construction market competition in your region
Recommendations
To mitigate the volatility of variable inputs to construction costs in the current economic and political climate, our clients should adopt strategic measures to ensure their projects stay attractive. Structuring projects in a way that will optimize contractors´ interests, while mitigating the cost risk exposure, will improve pricing and market responsiveness. By adopting our recommendations below, project stakeholders can enhance contractor engagement, stabilize cost structures, and improve overall project viability in a dynamic construction environment.
- construction escalation contingency: we recommend carrying long-term historical escalation of 3.5%-4.0%(Vermeulens) annually to the procurement date for construction in slower construction markets and 4.0% to 6.0% in busier construction markets
- near-term projects: should consider an additional 2% to 4% bidding contingency in 2025 depending on owner risk tolerance
- long-term projects: should consider a 4% to 8% bidding contingency for 2026 and beyond depending on owner risk tolerance
- engage a construction manager: involve construction managers in your planning process but only engage those with active market insight and an ability to estimate during the preconstruction stage, rather than engaging what we call ´bid takers´
- avoid unnecessary cross-trade coordination: particularly with early bid packages this will limit bidders for sequential bids
- limit bid alternates: incorporate no more than five substantial “program” alternates, not finishes and trim. Make your project/design as attractive as possible for the subcontracting market
- establish flexible scheduling: provide ample time and realistic project schedules, as supply chain disruptions labor shortages, and unpredicted market-driven costs will fluctuate
- minimize contractual penalties: avoid liquidated damages and restrictive working hour requirements
- standardize and simplify design elements: deliver clear, precise, and fully coordinated plans and specifications
- review your payment terms: implement contractor friendly payment structures
Cost Drivers
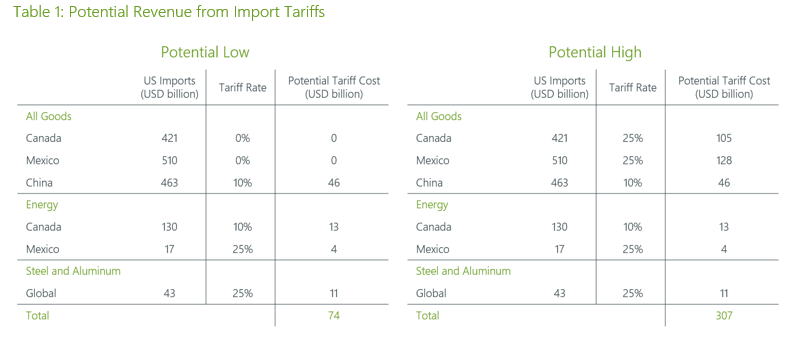
Tariffs (see Table 1)
- steel and aluminum: 1% of GDP
- all goods: 25% Canada, 25% Mexico, 10% China: 1% of GDP
- energy: 10% Canada, 25% Mexico: 0.06% of GDP
- reciprocal tariffs: 1% to 2% on imported goods ($3.3 trillion USD) or +0.15% of GDP
- retaliatory tariffs: equivalent retaliation per GDP ratio: 0.12% of GDP
- total impact: of 1.43% of GDP
Monetary and Fiscal Policy
- fuels construction activity which in turn affects labor and competition which will diminish or escalate the tariff impacts stated above
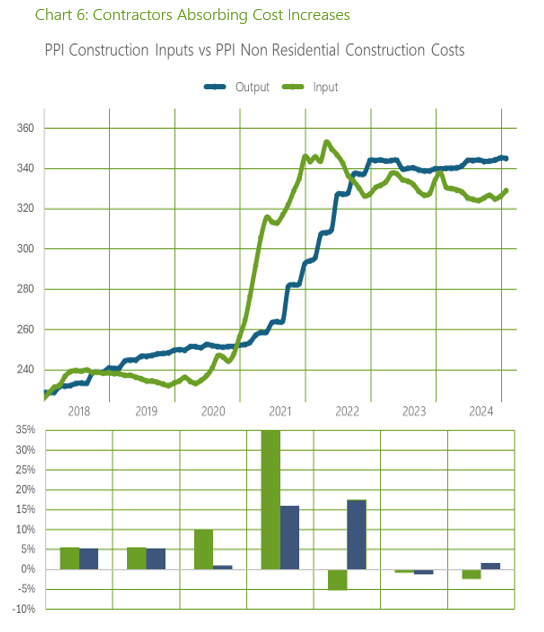
- in some cases, a slow market could completely absorb cost increase as seen in 2020/2021 (see Chart 6)
Labor Shortages
- the construction workforce is aging and the demand for highly skilled labor like mechanical and electrical trades are resulting in higher wages for skilled trades and competition for highly skilled labor
- in addition to tariffs, construction costs may see 0% to +6% cost swings due to labor and will vary by region and project type
Market Competition
Competition is "King" As outlined in this paper, a substantial amount of construction costs can fluctuate drastically with changing market conditions. It is difficult to quantify but it is not unheard of to see a 100% range in bid prices even based on 100% contract documents. Therefore, given this real market fluctuation, a -10% to +10% is not unreasonable for the impact of construction. This is dependent on the volume of construction activity in the region.
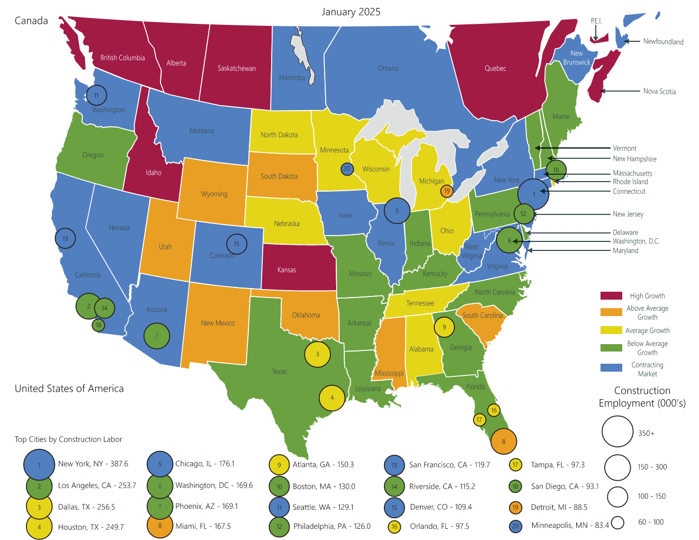
Image 1: North American Construction Labor Growth
(Bureau of Labor & Statistics)
Supporting Documentation
About Us
Vermeulens is an independent construction economics advisor operating within the North American institutional construction market. We specialize in projects spanning the sectors of higher education, healthcare, science+technology, cultural, research and civic works. Our team analyses detailed construction cost data from approximately 200 projects each year, collectively valued at $15B+ USD. Extensive bid and reconciliation data enables us to benchmark, estimate, and negotiate institutional building costs around the country. This provides owners and architects with detailed and accurate costing reports based on information from our comprehensive database, knowledgeable staff, and tested and proven processes. Detailed project budgets from the outset help to minimize the loss of program and quality and avoid costly re-design. We specialize in preconstruction services, which include programming through construction documents cost estimates, reconciliation of scope to budget, value engineering, and bid review.
Preface
In February 2025, the Administration bypassed Congress to sign an executive order which would “counter trade practices that undermine national security” and enact global tariffs on steel and aluminum, additional tariffs on all goods from Canada, Mexico, and China, energy import tariffs and the proposal for more to come. Exercising the authority under Section 232 of the Trade Expansion Act of 1962 (cite reference: whitehouse.gov) this executive order aims to “revitalize the domestic steel and aluminum industries”. However, it has proven to be a moving target with tariffs fluctuating by trading partner or economic bloc, making it difficult to assess in real-time, the impacts of the proposed import tariffs on America´s construction industry.
Consequently, the American construction industry is contending with the unprecedented and changing global trade policies proposed by the Administration. As one of the most volatile industries due to the vast number of variable inputs, the demand for skilled labor, and substantial cost movement in different markets, the construction industry at large is trying to predict the impacts of pending trade tariffs amongst its always turbulent market conditions.
In our estimation, the new Administration’s proposed tariffs on imported materials, particularly steel and aluminum, are likely to disrupt global supply chains and inflate costs in the near-term. The extent of the tariffs remains unclear; however, this study assumes a 25% import tariff on steel and aluminum from all countries with no exclusions. A 25% tariff on all Canadian and Mexican goods except for energy which will be imposed a 10% tariff. This is in addition to the 10% tariff recently applied to all imports from China. On March 11, the Canadian tariffs were announced to increase to 50%, however was backtracked later in the day. There is also talk of automobile, pharmaceutical, and microchip tariffs. For the purposes of this study, we have considered the following:
- 25% on all steel and aluminium imports
- 25% on all goods from Canada and Mexico
- 10% on energy from Canada
- 10% on all goods from China
Reciprocal tariffs are tariffs put in place in response to foreign countries imposing tariffs on United States goods. The Administration has vowed to implement such tariffs. Retaliatory tariffs are tariffs put in place by foreign countries in response to tariffs being imposed to goods they export. These create a vicious cycle where tariffs match counter tariffs and continue to climb. These two types of tariffs have been floated as a possibility with the latter being more detrimental to countries already subject to United States import tariffs, like Canada and Mexico.
When the Vermeulens team embarked on this paper, our intent was simply to study the impact of steel import tariffs and how they might impact construction costs for institutional projects in the United States. As our research progressed, we found that a tariff on steel, as a standalone variable, may have a minimal impact on the overall cost of construction, albeit a massive disruption to the steel and aluminum markets and an economic decline consequently, for Canada, Mexico, and China. However, it is our opinion that other factors, driven by overall market activity, will truly dictate the impact of tariffs on construction costs.
Using Vermeulens’ internal construction cost data and insights, the following study lays out the high and low potential revenue and cost burden from import tariffs to provide data-backed scenarios and informed recommendations that aim to help our valued clients navigate the complexities of new trade policies, effectively and objectively, from our specialized perspective.
Law of Supply and Demand
The law of supply and demand states that in a free economy consumers are free to choose if they would like to buy goods or services. If prices are high, the demand will be lower and vice versa. If prices are high, supply will increase and vice versa. There is a give and take until an equilibrium quantity and price are established by consumers and suppliers. It is important to understand this theory when now shifting to a controlled economy as such is with import tariffs.
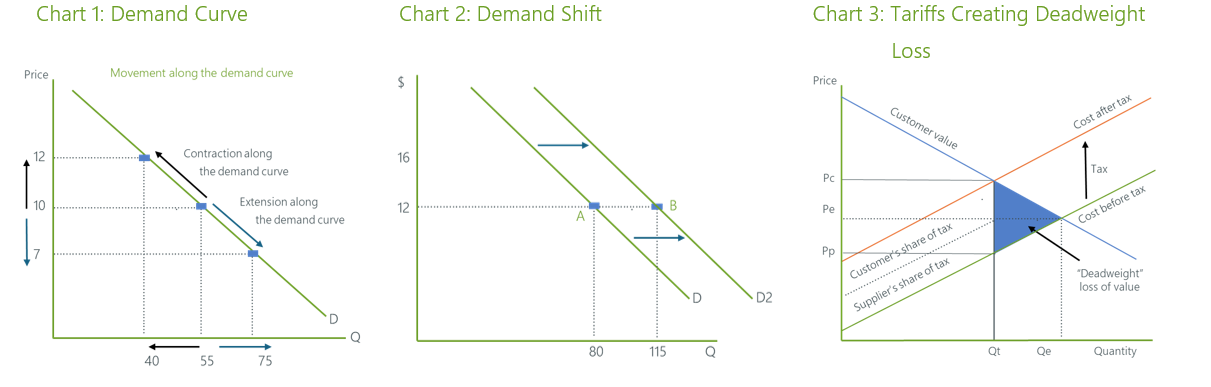
The demand curve shown below on Chart 1 demonstrates the ‘law of demand’. Imposing tariffs on imported goods will generally cause contraction along the demand curve. The theory is that as prices increase due to tariffs, the demand will reduce and move along the curve. If we assume the market price is 10, the corresponding demand is 55. If the price moves to 12 then demand will fall to 40 and the opposite for price decreases.
To quantify demand/price shifts there are countless theories and formulas that attempt to calculate the change in demand with the change in price. The ‘demand elasticity’ is the result of these calculations and has been quoted to be -1.5% for construction costs in the United States. This means, in theory, that a 1% increase in price would result in a 1.5% decrease in demand.
For fiscal policy changes (government spending and taxation) there will often be a shift in the demand curve, which is shown on Chart 2. The theory is that at price point A the demand is 80, following fiscal stimulus consumers may have a higher demand at that same price point and shift the curve to the right to 115.
In addition to increased costs and reduced demand there is an overall net ‘deadweight’ loss of value that results from altering financial markets. This is the value lost when supply and demand are not in equilibrium, which is shown on Chart 3. Pe and Qe represent the supply and demand equilibrium pre tariffs. Pc is the resulting price to the consumer and Pp is the price received by the producer. The blue shaded area is the economic loss called ‘deadweight’. The delta between Pc and Pp frame the tax revenue and the true supply and demand curves will dictate the magnitude of consumer and producer tax burden.
Steel
In 2023, United States steel mill production reached 81.4M metric tons (MMT), while global imports accounted for 25.58 MMT. (cite reference: American Iron and Steel Institute 2024 and International Trade Administration)
- Canada: 24 MMT, 24.4% of total United States steel imports, valued at $7.9B USD
- Mexico: 8 MMT, 14.9% of total United States steel imports, valued at $4.2B USD
- Brazil: 57 MMT, 14% of total United States steel imports, valued at $2.8B USD
- rest of the World: 96 MMT, 46.7% of total United States steel imports, valued at $19.2B USD
Downstream Steel Product Imports for Domestic Consumption: 2023
- China: $1.65B USD, 18.8% of total United States steel product imports
- Mexico: $1.57B USD, 17.8% of total United States steel product imports
- Canada: $663M USD, 7.2% of total United States steel product imports
- rest of the World: $4.99B USD, 56.2% of total United States steel product imports
Domestic Steel Production Capacity
In 2023, United States steel production was at 81.4 MMT and ran at a capacity utilization rate of 75.4%. If tariffs result in the reduction of steel imports, domestic manufacturers have capacity to offset some of the lost supply. In the current market steel rates are competitive for both United States and Canadian made steel. If foreign imported steel costs are increased due to tariffs, it is likely that United States mills will take the opportunity to increase to the higher cost of imported steel or some portion of it.
Supply Chain Disruptions Caused by Tariffs on Construction Material Inputs
The implementation of trade tariffs on construction material inputs poses a significant risk to the supply chain. Key disruptions could include:
- increased costs and reduced material availability: tariffs on imported materials such as Canadian steel, may raise costs and limit availability, depending on market demand and domestic production capacity
- shifts to alternative suppliers and domestic production: contractors may pivot to suppliers outside the regions affected by the tariffs, introducing logistical challenges and adjustment delays. Simultaneously, domestic producers could face strain from increased demand, potentially resulting in higher prices and longer lead times for locally produced materials
- project delays and cancellations: higher material costs, procurement difficulties, and overall supply chain disruptions could lead to significant delays or cancellations, particularly for budget-sensitive public infrastructure projects
- increased competition for essential materials: tariffs may trigger intense competition among construction companies for limited materials, creating a procurement race. This heightened demand could disrupt project timelines, as companies prioritize securing materials to maintain operations
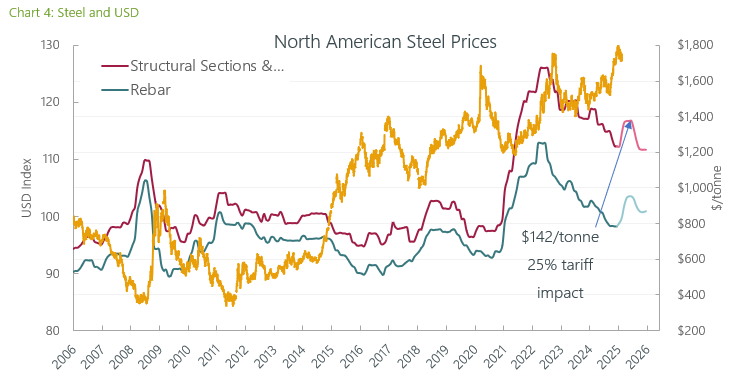
The global market for steel trades with USD in the commodities markets. Because of this, the value of steel and other commodities will fluctuate with the value of the USD alone. The USD value relative to other major currencies moves for many reasons but is often directly corelated to interest rates. Therefore, increased interest rates attract investors and tend to increase the value of the USD. This can lessen the impact for foreign countries exporting to the United States. However, lower interest rates could decrease the value of the USD which would increase the cost to foreign exporters to the United States.
In Chart 4, the supply price over time of fabricated structural steel and rebar is graphed compared to the US dollar index. This data set is currently forecasting a $142/tonne increase on all (domestic and imported) fabricated structural steel because of the 25% steel import tariff. The chart also shows that the price could come back down later in 2025 assuming a reduction in demand and increased domestic supply.
Aluminium to be included in our next update
Energy
As of March 12, the United States imposed a 10% tariff on energy resources from Canada in lieu of the 25% tariff on all goods for Canada and Mexico. Energy from Canada currently accounts for 60% of United States oil imports, 4 million barrels per day (BPD), with 70% of that oil being processed in Midwestern refineries; while Mexico supplies 450,000 BPD, which is largely processed in Gulf Coast refineries. The effect of these tariffs will be an increased input cost for American refineries, leading to higher prices for gasoline and other fuels, which will likely be passed onto consumers. However, as we are seeing in the futures markets for oil, demand is slowing and prices for oil are in decline.
The Administration´s initial proposal was to place 25% tariffs on all Canadian and Mexican energy imports, but the administration has since lowered the tariffs on Canada´s imports to 10%, to ease pressure on energy prices. Despite this concession, tariffs will disrupt the integrated oil trade, as American refineries are optimized for heavy and medium crude oil from Canada. Midwestern oil refiners lack alternative feedstock sources, making them especially vulnerable, while Gulf Coast oil refiners will have more options to replace Mexican crude oil with seaborne imports.
Tariff Impact on Construction Costs
‘Ceteris paribus’ is a phrase commonly used in economics to allow for the impact analysis of one variable, while assuming all other variables are unchanged or constant. In Chart 5, we summarize the findings of a single variable study that we have conducted for steel and steel products. Based on three of our major United States institutional projects in science+technology, research, and civic centres from around the country, we have extracted the value of steel, increased its costs by 10%, 15%, and 25%. With the increased steel rates the recalculated project total costs increased between 0.4% to 1.1% based on the steel tariff scenarios, ceteris paribus, overall.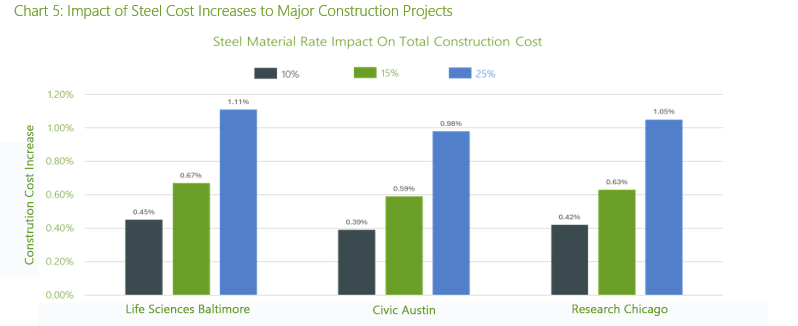
Tariff Impact on the United States Economy
In Table 1, we have isolated the major United States import values that have been discussed by the Administration including: steel, aluminum, energy, and possibly all goods. Depending on the actual tariffs implemented, we have calculated a revenue range for the United States economy between $74 to $307B USD, representing 0.27% to 1.1% of the 2024 $27.6T USD economy. Given the unpredictability of the Administration’s executive order, we have aimed to produce a tariff projection for revenue and, in turn, cost burden for the United States consumer, which we surmise based on our internal numbers, would be lower than 0.27% to 1.1% and is a conservative range for direct cost impacts to construction.
Tariff payments will result in revenue for the federal government, although the American public will likely bare much of the cost along with foreign countries. It is unlikely that the full burden resulting from tariffs will be passed onto the consumer, but none-the-less demand for goods and materials will undoubtedly fall and prices will increase. As mentioned in the previous section, exchange rates will either improve or worsen this impact.
There is no correct way to quantify the potential impact of retaliatory tariffs nor reciprocal tariffs. As of February 19th, 2025, the White House has announced reciprocal tariffs in lieu of blanket ‘all goods’ tariffs due to concerns of a levelling in the Consumer Price Index and potential inflation with an “all goods tariff”. However, on February 20th, 2025, several news sources are claiming the tariff remains on ‘all goods’ according to Goldman Sachs if reciprocal tariffs are imposed in a balanced way, meaning matching foreign tariffs, they will increase revenue/cost by 1% to 2% of all imported good from foreign countries, which equates to+0.2% to +0.3% of GDP. Retaliatory tariffs like we are seeing from Canada will only exasperate the situation in the United States but more so in Canada with exports suffering and imports rising in cost.
For comparison purposes, if we assume that retaliatory tariffs equal roughly the amount of United States tariffs, United States exporters would need to reduce their pricing of a similar magnitude to the overall tariff impact imposed by the United States. This would result in lower exports and likely a loss of jobs in the sectors reliant on foreign exports. Therefore, retaliatory tariffs would likely have a deflationary impact on foreign economies and likely create a vicious cycle. To maintain their current market share, exporters would need to lower their cost or face downsizing.
In total, the cost impacts could amount to 0.5% to 1.4% of GDP in tariff revenue or cost increases that will partially pass on to the American consumer. This will be dampened by reduced costs/exports for foreign counties retaliatory tariffs.
In 2020-2021 the construction contractors absorbed most cost increases to maintain work backlog. However, many contractors, particularly in the electrical trade suffered some substantial losses and will be cautious about absorbing these increases. This may result in a quicker pass thru of cost increases to the consumers.
Fiscal Policy Impact
Although import tariffs on goods, steel, aluminum, and energy would likely induce short-term cost increases of 0.5% to 1.4% for the American consumer, with an additional 0.4% to 1.1% cost increase for construction projects attributed to the proposed 25% global tariffs on steel and aluminum, there are larger factors still to be considered.
Back in November 2024, the Administration also floated the idea of lowering taxes, increased spending on infrastructure and innovation investments: up to $500B USD for building AI infrastructure (10 Stargate locations), $100B USD for data centers
(initially for OpenAI’s Stargate), “Freedom Cities” built on federal land, and even flying cars. Should tax reforms or federal expenditures be enacted for such initiatives. It is our opinion that the economic impact of this level of government spending and tax reduction, could result in a ‘trickle-down” economic impact resulting in higher consumer demand and consequently cost increases. Should tariff revenue be successful, theoretically it could be recycled back through the economy to support these types of proposed infrastructure and innovation initiatives. This level of government spending in addition to import tariffs would likely lead to increases, not only in construction costs, but the cost of all goods and services in the United States.
Monetary Policy Impact
When we think back to the COVID-19 pandemic, in response to the rapid job losses the Federal Reserve bought $5T USD (reference turquoise line) in assets (2020-2022), compared with only $1T USD during the financial crisis (2009 to 2011). This asset purchase was then coupled with a zero-interest rate policy (ZIRP) (reference purple line), which spurred an unprecedented demand for goods and services. Shifting the demand curve to the right as per Chart 6 above and resulted in substantial price increases, aka inflation (PCE: Personal Consumption Expenditures).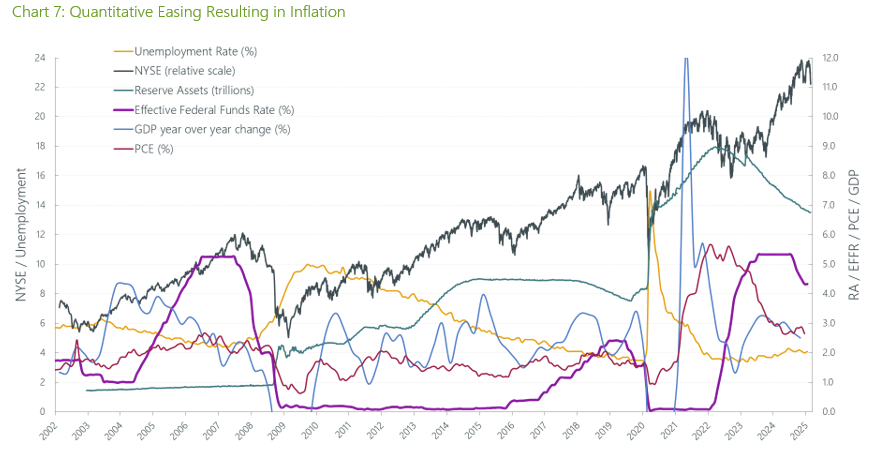
In 2022, what came to pass was the Federal Reserve reversed its levers to sell their assets and raise interest rates. This action lowered the level of economic inflation back to the 3% range, but still above the 2.2% target.
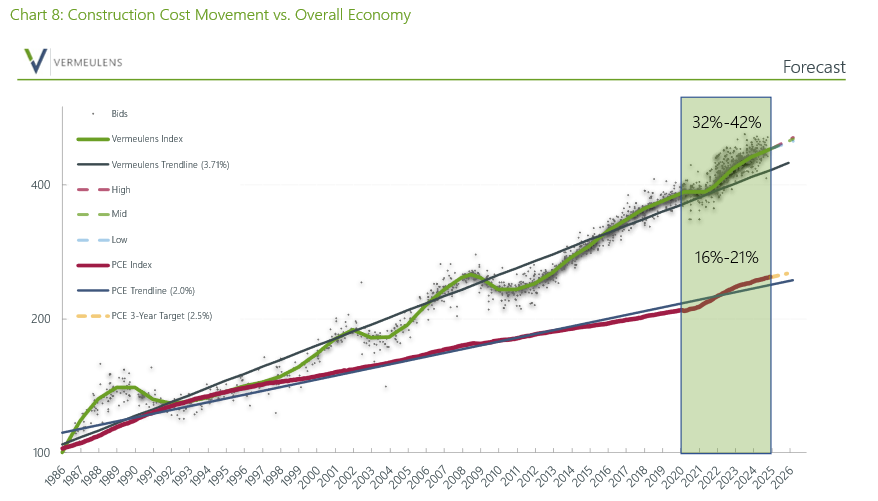
Consequently, since 2020, construction costs have soared 35% to 40% above pandemic levels. Vermeulens’ Construction Cost Index (Chart 8) illustrates the dramatic difference in price movement (refer to green line) and overall inflation (refer to red line). This is proven by both the price increases and decreases in construction costs, they are magnitudes greater than the overall United States general economy, as we have illustrated.
Construction Labor
As the construction market accelerates, so do the demands on labor. Unfortunately, this trend is exasperated in our industry, as the number of professionals leaving construction is greater than the number of people desiring to enter skilled trade. While demand for construction work is at an all-time high, unemployment in the construction sector is currently exceptionally low. Added to this, the new administration has pressurized these labor constraints through undocumented worker deportation efforts.
As a matter of fact, nearly 40% of the construction workforce in the United States is comprised of minority workers, with at least 13% of those workers being undocumented. In states such as Texas, undocumented workers realistically account for closer to 50% of the construction labor force.
As building projects become more technically advanced and infrastructure in the technology sector is increasingly built for AI and data centers, so too will be the pressure and demand for a skilled workforce in mechanical and electrical trades. As one electrical contractor union in Texas has expressed, contractors and workers are looking for a 35% increase for their labor rates in 2025. Perhaps it is unlikely that they will receive a 35% increase to their labor requests, but an increase of between 15% or 25% could result.
In regions of rapid growth, like Texas, continued signing bonuses for construction workers in the range of 15%, for the type of large-scale projects that Vermeulens oversees. In such economically uncertain times such as these, contractors have often had to offer premium time shifts, just to keep labourers on their payroll.
To provide context, for one of our average construction projects, the labor component is typically 30%. If this cost is then multiplied by another 5%, 10%, or 15% pay increase, it would result in a 1.5% to 4.5% rise, pushing overall costs of construction projects to a new level. In our opinion, the impact of increased monetary and fiscal stimulus from the federal government would put upward pressure on labor costs in this projected range.
Industry Competition
From tariffs and stimulus to labor and exchange rates, the ultimate driver of construction costs will be global demand, which spurs competition. From our perspective, competition is ‘King´ but more specifically, how much contractors are willing to work and want the work will be the true dictator of construction costs. Construction projects and their respective costs are always composed of:
- labor: hourly wages paid to construction workers
- materials: raw material inputs such as steel, copper, and drywall
- overhead: managerial staff, IT, accounting, and equipment depreciation
- profit: amount of earnings above and beyond the sum of the above
- risk: (TBD)
The volatility of labor and material goods are often difficult for, even specialised, contractors to control, regardless of the economic and political climate. However, in our experience, the overhead and profit (OH&P) portion of costs along the supply chain, which are roughly +40% of cost, is this biggest impact to overall construction costs, because it can be moved up or down at a contractor´s discretion. If contractors are hungry enough, the OH&P values will inevitably decrease, sometimes to levels we call ‘at cost’ as seen during the early onslaught of the COVID-19 pandemic.
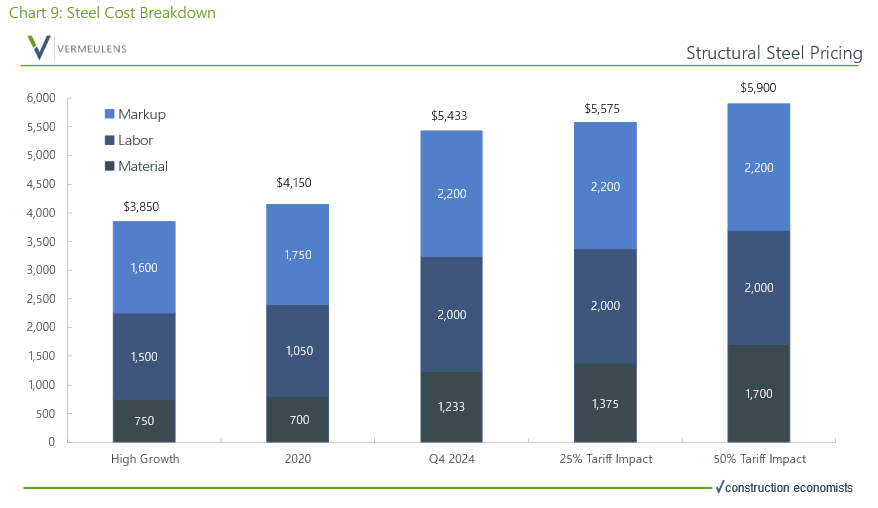
Chart 9 shows the three inputs to structural steel pricing, material, labor, and markup. The last two bars show the impact of both a 25% and a 50% tariff on the average installed cost per ton of structural steel. Compared to the Q4 2024 average cost per ton of $5,433, the 25% tariff average cost per ton increases to $5,575, and the 50% tariff average cost per ton increases to $5,900.
In 2024 and in these early months of 2025, our team has seen this playout first-hand. Working on two nearly identical construction projects, both in large metro markets in Texas, contractor bids were approximately 25% apart in costs. The buildings had the same program, materials, and labor force, making it clear that the disparity in the cost, was the attractiveness of the project. In another recent scenario, we have a project coming in 35% higher than a dozen other projects similar in type and scale. In both examples, we view competition as the primary cost driver; largely influenced by overall construction market activity which, in turn, tends to fluctuate based on monetary and fiscal policies, whether stimulative or restrictive.
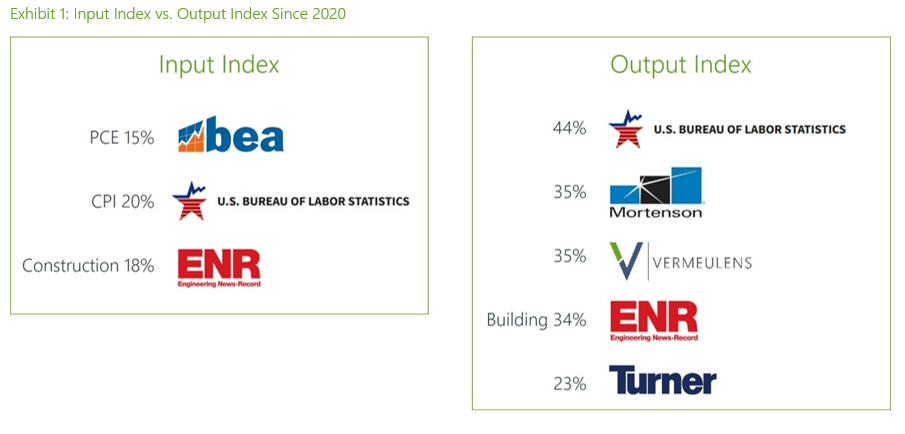
Input Index vs. Output Index
Many construction cost indices like Consumer Price Index (CPI), Engineering News Record (ENR), Bureau of Labor and Statistics (BLS) and Personal Consumption Expenditures (PCE) measure the input costs to construction, drywall material, pipe materials, labor, etc. Other indices like Vermeulens, Turner Construction, and Mortensen Construction measure bid prices. The terminology we use to distinguish the two is ‘input’ vs. ‘output’ indices. An ‘output’ index considers the flexibility in markups (per above), buying power, efficiency, fear and opportunism. Whereas an ‘input’ index will miss these key variations. If you are an owner, an output index is best suited for you. If you are a subcontractor, an input index is best suited for you.
Summary
As we have outlined above, the impact analysis of one variable, while assuming all other variables are unchanged, or constant, is not a realistic method of analysis. Tariffs will increase the cost to construction and increase the cost of all goods and services in the short-term, but to a greater impact the monetary and fiscal policy will propel costs. The reason for the latter is that the amount of work a contractor has in their backlog, the higher the cost. Therefore, the range of cost impacts needs to be broken down further. One scenario is increased stimulus and healthy backlogs. Another scenario is rapid cost increases and a slowing of work/backlog for contractors. It is key to know which market you are working in.
Increased Stimulus = Increased Construction Activity
- higher construction demand: will drive up costs and reduce competition from contractors for the work. Increased demand would be the likely result, should there be new government spending and quantitative easing
- the direct impact of the proposed trade tariffs: as they currently stand, we anticipate being 0.5% to 1.1% of total construction costs. In addition to the historical average of 3.5% to 4.0%
- the direct impact on the economy: we anticipate will be inflationary
- labor shortages: in this case, would likely result in a 2% to 6% increase to construction costs
- contractor overhead and profit (OH&P): will increase in busy markets
Short-term impacts on construction costs may be as low as 3.5% however, mid-to-long-term impacts could inflate to 11% or higher, well beyond the historical average construction cost increase of 3.5% to 4.0%.
Decreased Stimulus = Decreased Construction Activity
- lower construction demand: will increase competition from contractors for the available work. The corresponding reduction for the costs of labor, could help cushion the impact of global trade tariffs and perhaps moderate overall project costs
- overall, the current construction labor market: continues to grow at a rate double the rest of the US economy. However, current construction labor market indicators are showing a decline in some markets (see construction weather map Image 1 above). Lower construction demand from decreased stimulus could change this rapidly. Our construction weather map tracks this monthly
- lower construction demand: may result from quantitative tightening and reduce spending due to the pending trade tariffs
- the direct impact of the proposed trade tariffs, as they currently stand: we anticipate being an increase to construction costs of 0% to 1%
- the direct impact on the economy: we anticipate will be inflationary
- labor reductions: in this, case would likely result in a negative to 2% increase to construction costs
- overhead and profit (OH&P): will reduce in markets that are slowing
Short-term impacts on construction costs may be as low as 0%, or potentially even negative, however, mid-to-long-term impacts could reach 3.5% to 4.0%, in-line with the historical average construction cost increase.
Case Study: Structural Steel Rates
As discussed above, structural steel rates are composed of three factors: material costs, labor costs, and markups. Material costs typically account for 30% to 40% of the overall cost of structural steel rates, depending on the market conditions for labor. As such, should there be an increase of, for example, 15% to the material costs for steel, this would result in a 6% increase to the overall cost of structural steel.
To illustrate this more clearly, in Appendix A we provide detailed cost tables for three of our current projects and have applied a, theoretical, 10%, 15%, and 25% increase to material costs for steel to all line-item costs potentially affected by the proposed tariffs.
These line items have been grouped by category and include plumbing, fire protection, HVAC systems, electrical, interiors, and civil materials. For each line item, we considered the specific material-to-rate ratio and subsequently applied material cost increases, based on its reliance on imported products, to ensure the most detailed and accurate assessment of the impact of tariffs. As this analysis demonstrates, despite a potential increase to the material costs for steel, the impact on overall project costs would remain minimal.
Appendix A: Detailed Cost Tables to be included in our next update