


- Construction Prices: Flat through Q2 and Q3 of 2020; one in ten projects showing cost reductions with strong contractor coverage across the board
- Fed Watch: The Federal Reserve continued monetary stimulus in line with the “new normal”
- Architectural Billings: Continued to decline through Q3, while providing encouraging signs for recovery near the end of 2020; both August and September have shown a net increase in inquiries
- Construction Dollar Volume: Continued its steady rise back to Q1 levels, led by residential construction volume which has fully recovered
- Construction Job Growth: Approximately 122,000 construction jobs were added this quarter or 1.7%; construction employment is still down 5.2% since its Q1 highs
- New York Stock Exchange: The stock market grew by 6.8% in Q3; the NYSE is still approximately 9% off its Q1 highs but has recovered back to 2019 levels
- Growth in Employment: Monthly average job growth through Q3 was 1.3M; recovery continues at a slow pace, indicated by the 6-month rolling average which is now at -1.5M
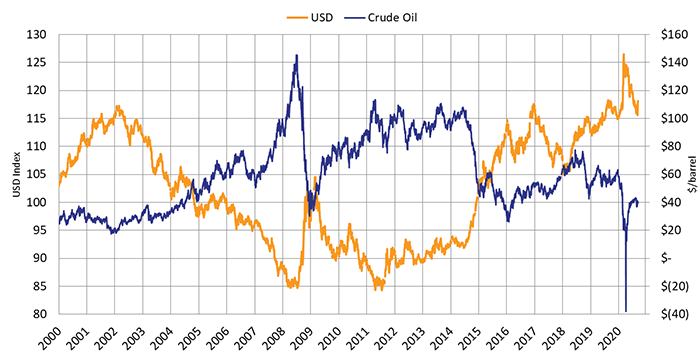
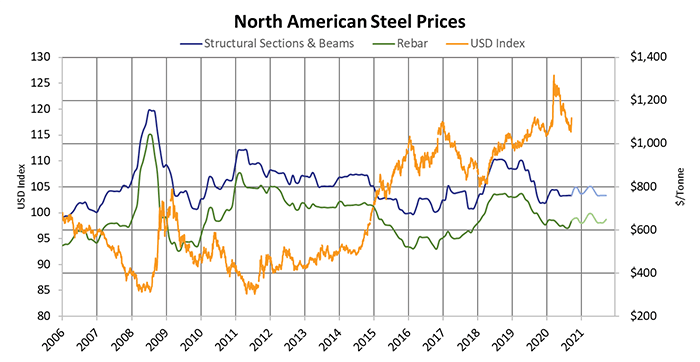
- Commodities: Covid 19 projections, residential construction spikes, and natural disasters have created short term price spikes in both PVC (30%) and lumber (100%)
- Gross Domestic Product: Initial GDP projections point to an annualized growth rate of 20.3% for Q3 2020; this is a sharp reversal of the 37.9% drop in Q2
- Consumer Price Index: Q3 CPI has recovered and is at +1.32% year over year (September 19/September 20)
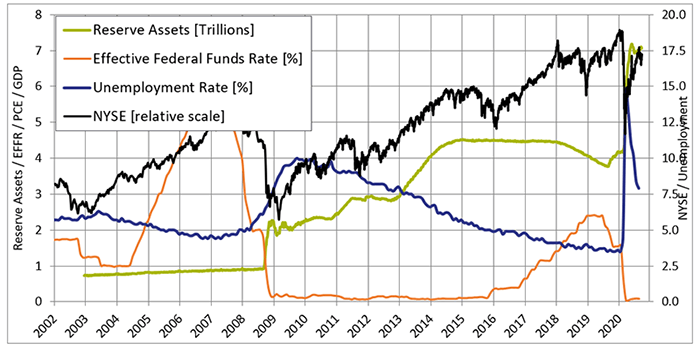
Fed Watch (all data to January 1)
Inflation and employment targets propel monetary policy, and subsequently construction prices. The “new normal” of pushing inflation above 2% and high labor force participation will likely mean continued 0 to ¼ percent interest rates and continued asset purchases for a 3 to 5-year time horizon. Continuing low-interest rates are good for stability in the interest rate-sensitive construction sector. https://www.federalreserve.gov/mediacenter/files/FOMCpresconf20200916.pdf
Also, visit our Market Outlook Construction Forum slides and video for more info on this topic.
Market Outlook Construction Forum Sept 18, 2020 – PDF
https://www.gotostage.com/channel/7836bfba41854760a16f991a44002c5e
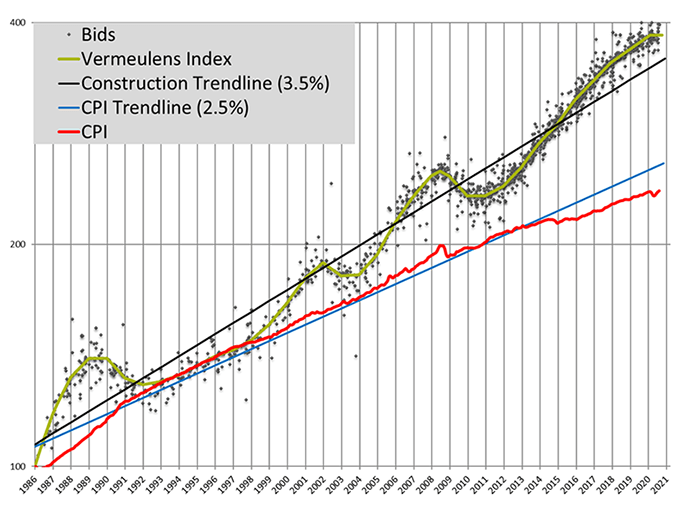
Vermeulens Construction Cost Index
As the backlog of construction projects continues to decline, cost projections are close to zero cost escalation in the near future.
Price increases for Q3 2020 nationally trended towards 0% annually.
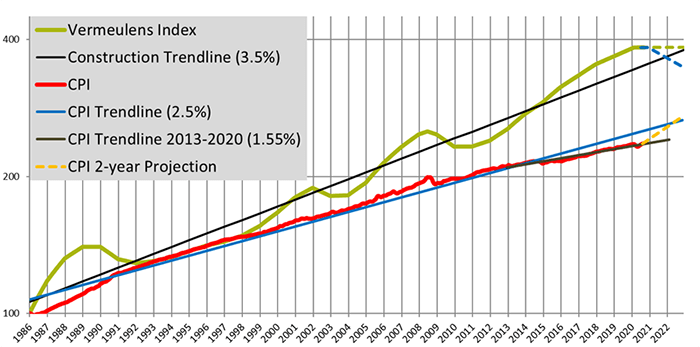
For the past 34 years, construction prices trended at a 3.5% annually compounded escalation rate. The rate of escalation seen in construction costs relates to the target of 2% annual inflation for consumer prices and the monetary policy used to achieve this goal. CPI inflation is below medium-term target of greater than 2%.
Following the global recession construction bid prices for institutional projects fell by 14% from their peak in 2008. During 2011, Vermeulens saw an average selling price increase of 3%. This was followed by a 6% increase in 2012, 8% in 2013, 6% in 2014, 8% in 2015, 6% in 2016, 5% in 2017, and 4% through all of 2018 and 2019. The effects of COVID-19 nullified projected increases in construction costs and have flattened the curve in the short term.
The chart below illustrates bid prices for Institutional Commercial Industrial (ICI) construction projects relative to the Construction Trendline (1986 = 100) of 3.46% and the 2.5% Consumer Price Index Trendline.
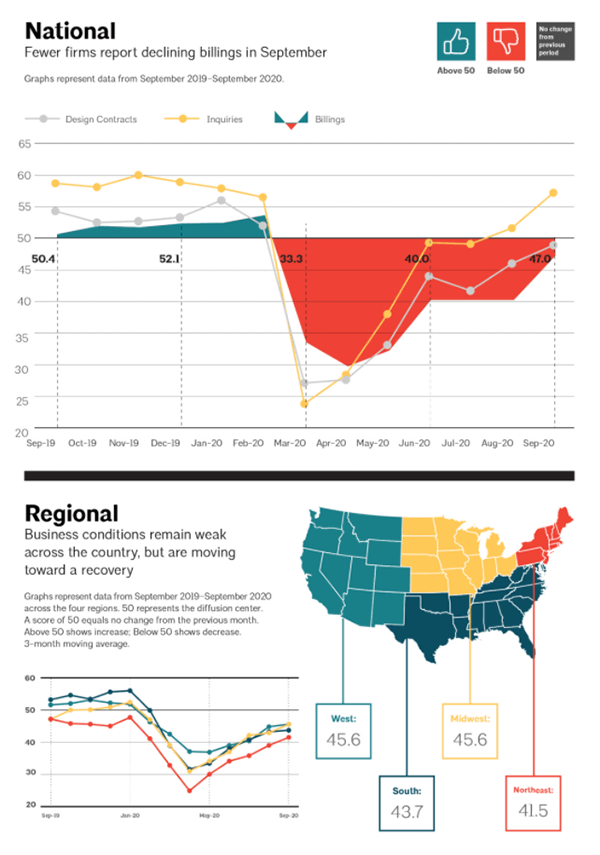
AIA Billings
Architectural billings are a leading indicator for future construction volume. A score greater than 50 indicates growth. Design fee billings typically indicate construction volume 9 -12 months in advance.
Architectural Billings have been poor for firms across the country over the last 2 quarters. Indicators nearing the end of Q3 provide encouraging signs toward the end of 2020 for inquiries and contracts.
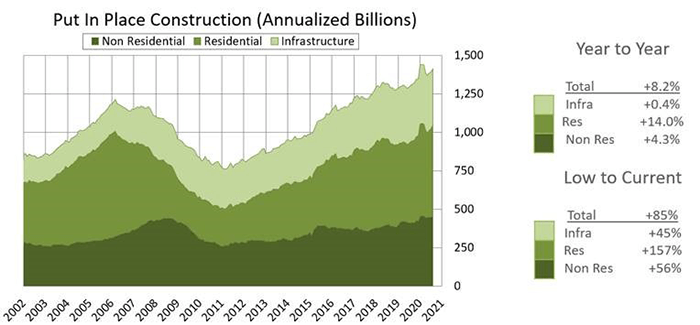
Put In Place Construction
Construction dollar volume saw encouraging growth in Q3, recovering 2.1% since Q2 while still maintaining an 8.2% year-over-year increase (Aug 19/ Aug 20). Construction dollar volume is the main driver of construction prices.
Residential dollar volume had a strong Q3, improving year over year by 14% (Aug 19/ Aug 20).
Non-Residential construction spending is up 4.3% year over year (Aug 19/ Aug 20). Reduced backlogs and margins have caused reduced escalation in this sector.
Infrastructure spending has recovered the slowest, showing a decrease in year-over-year spending by 0.4% (Aug 19/ Aug 20).
http://www.census.gov/construction/c30/c30index.html
Commodity Prices
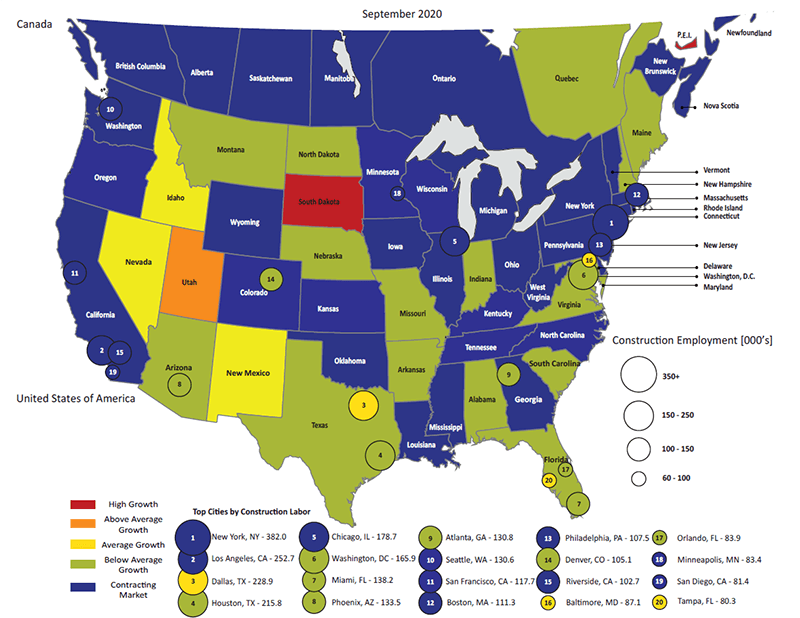
Construction Labor Market
Construction Unemployment at the end of Q3 sits at 7.1%, down from 10.1% at the end of Q2.
Construction Job Growth was 122,000 or 1.7%, this quarter. Stable wages in the sector will draw new entrants as other sectors of the economy restructure.
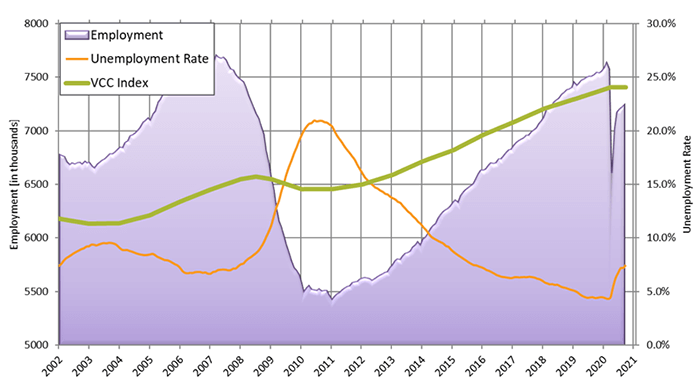
Construction Labor Force Growth Rate
Construction Labor Force Growth Rate is calculated by the current 12 month average in construction employment relative to the previous 12 month average in construction employment.
Total Jobs and Market Performance
Total Jobs in the US economy during Q3 2020 saw an average monthly increase of 1,304,000 jobs, as jobs became available once again through economic recovery efforts. 6-month moving average job growth numbers are still in the negatives, indicating there is still a long way to go to full economic recovery.
The chart below removes short-term fluctuations in job growth by looking at a 6-month moving average. The size of the labor force grows at 100,000 per month due to population increase. Sustained periods of recession, where job creation remains below 100,000 jobs per month, has accompanied dips in construction prices as illustrated by the red bars below.
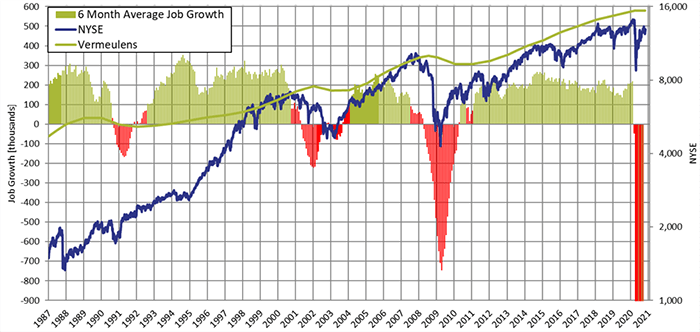
https://data.bls.gov/timeseries/CES0000000001
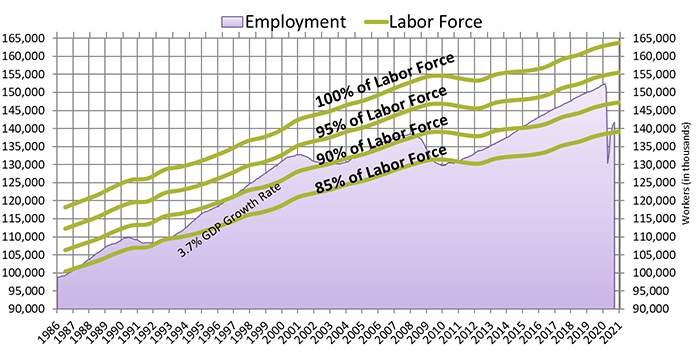
Employment Percentage of Total Workforce
Total Employment as a percentage of total workforce recovered from 80% to 86% in Q3 2020.
The chart below shows total employment as a percentage of the US workforce. The Federal Reserve will accommodate growth until full employment and inflationary pressure stay above target for a significant length of time. The workforce in the US continues to expand so the economy must produce at least 100,000 jobs/month to remain neutral.
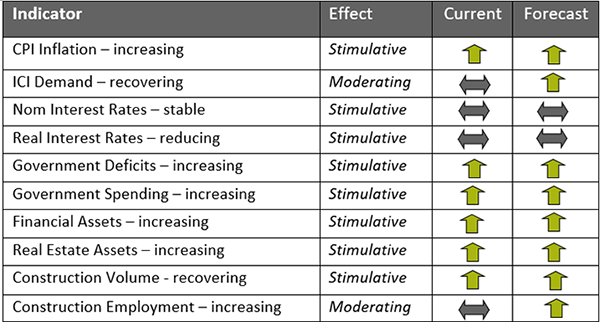
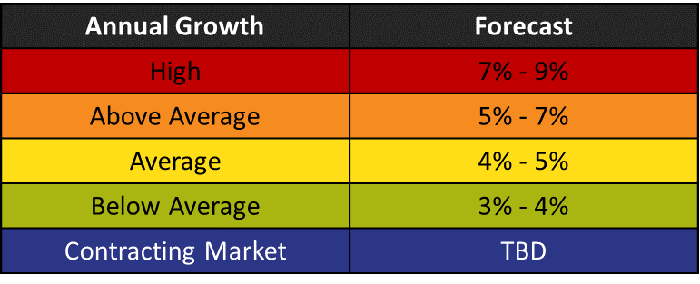
Forecast - National Trend
Construction prices remain flat in Q3 2020. Conservative recommendations are to carry long term inflation avarages of 3%-4% per annum, however as contractor backlogs decline there may be the potential for a market correction.
The Federal Reserve’s “new normal” will raise inflation above the recent trend of 1.5%. Short term inflation could exceed 2.5% for a 3 to 5 year period in order to re-establish the 2% long term target.
Vermeulens strives to give our clients the greatest possible value and results for their projects.
If you need any help with your projects, want to set up a presentation to your group, would like to meet to see how we can help your team, or are looking for company information,
Please contact: Marisol Serrao, Director of Marketing

James Vermeulen
Managing Principal
James is Managing Principal for the firm. Through his leadership and role as Chief Technologist and Lead Mechanical/Electrical Quantity Surveyor, he brings a set of skills, technical expertise, and knowledge to each project he works on.